W(hat's the)MATA: DC Metro issues
I moved to the DC Metro area in the middle of the months-long Metro shutdown, giving me an immediate taste of the region’s special relationship with the Washington Metropolitan Area Transit Authority (WMATA). Having lived in cities with varying degrees of public transit options, one long-term project I’d love to tackle is comparing public transit across cities.
Awhile back, I found a public dataset containing reported Metro issues from April 2012 to November 2016. I had some spare time this week, so I decided to visualize some trends in Metro issues, mainly to force myself to clean up the dataset. Hopefully, I’ll be able to locate similar data for other public transit systems.
Issues over time
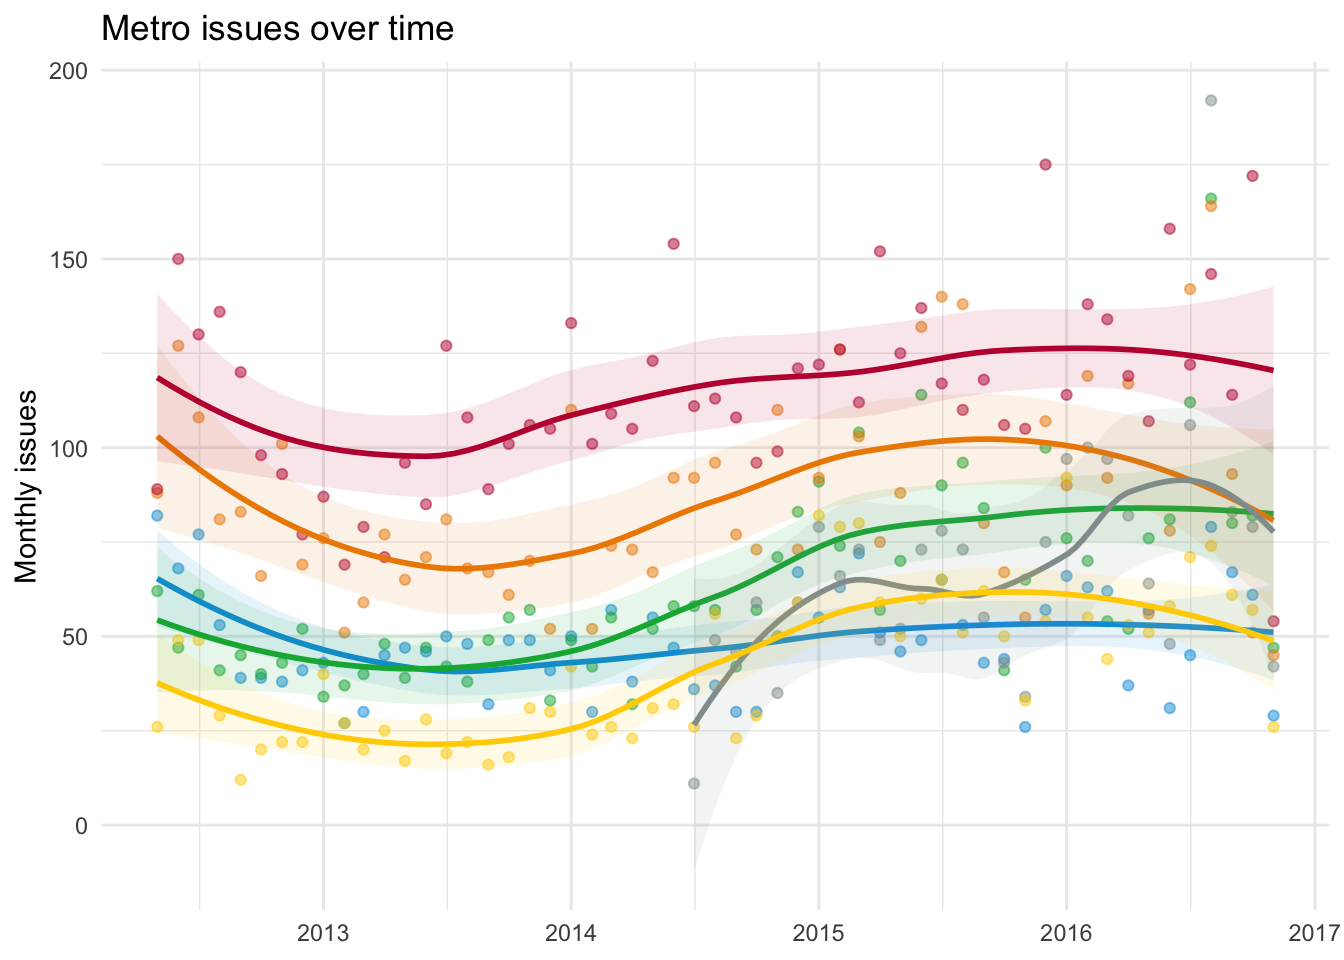
The following graph displays the total issues in each month contained in the dataset. Since the dataset covers only a few years, it’s hard to discern long-term trends. However, there is some stability in that window; the red line has the most issues in almost every month (it’s the oldest line), followed by the orange line. There are also some changes in that window; the yellow line had the fewest issues up to 2014, after which its issues increased to the blue line’s level. In addition, the silver line was only opened in 2014.
What’s the problem?
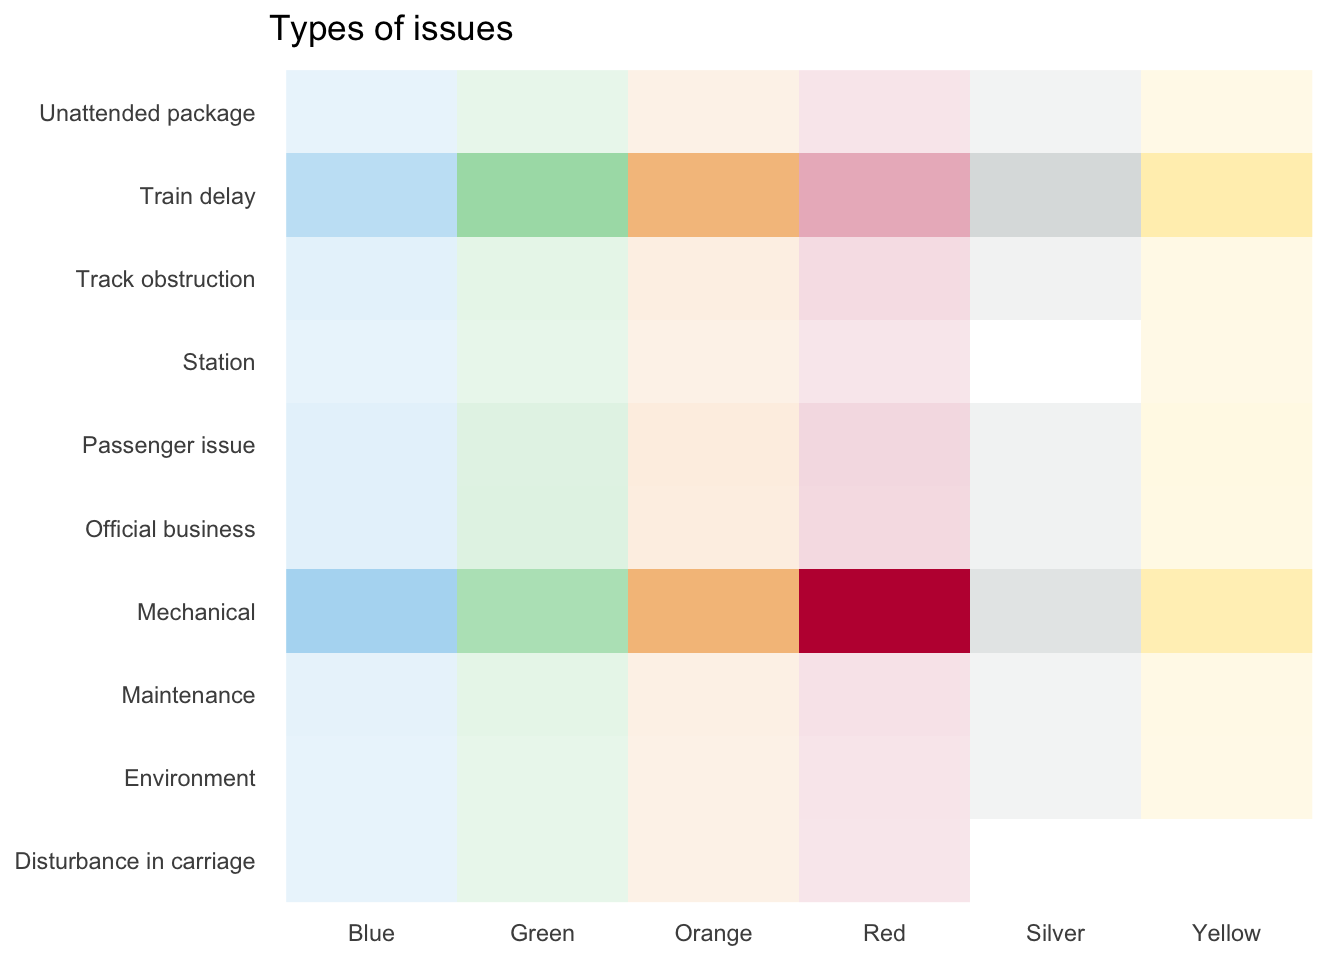
The following heatmap shows the relative frequencies of different types of problems. The most common problems are general train delays (trains are held up intentionally to adjust the overall schedule) and mechanical failures (trains held up because of malfunctioning parts). In addition, the red line appears to have way more mechanical issues than any other line, as you would expect from it being the oldest line.
Where are the issues?
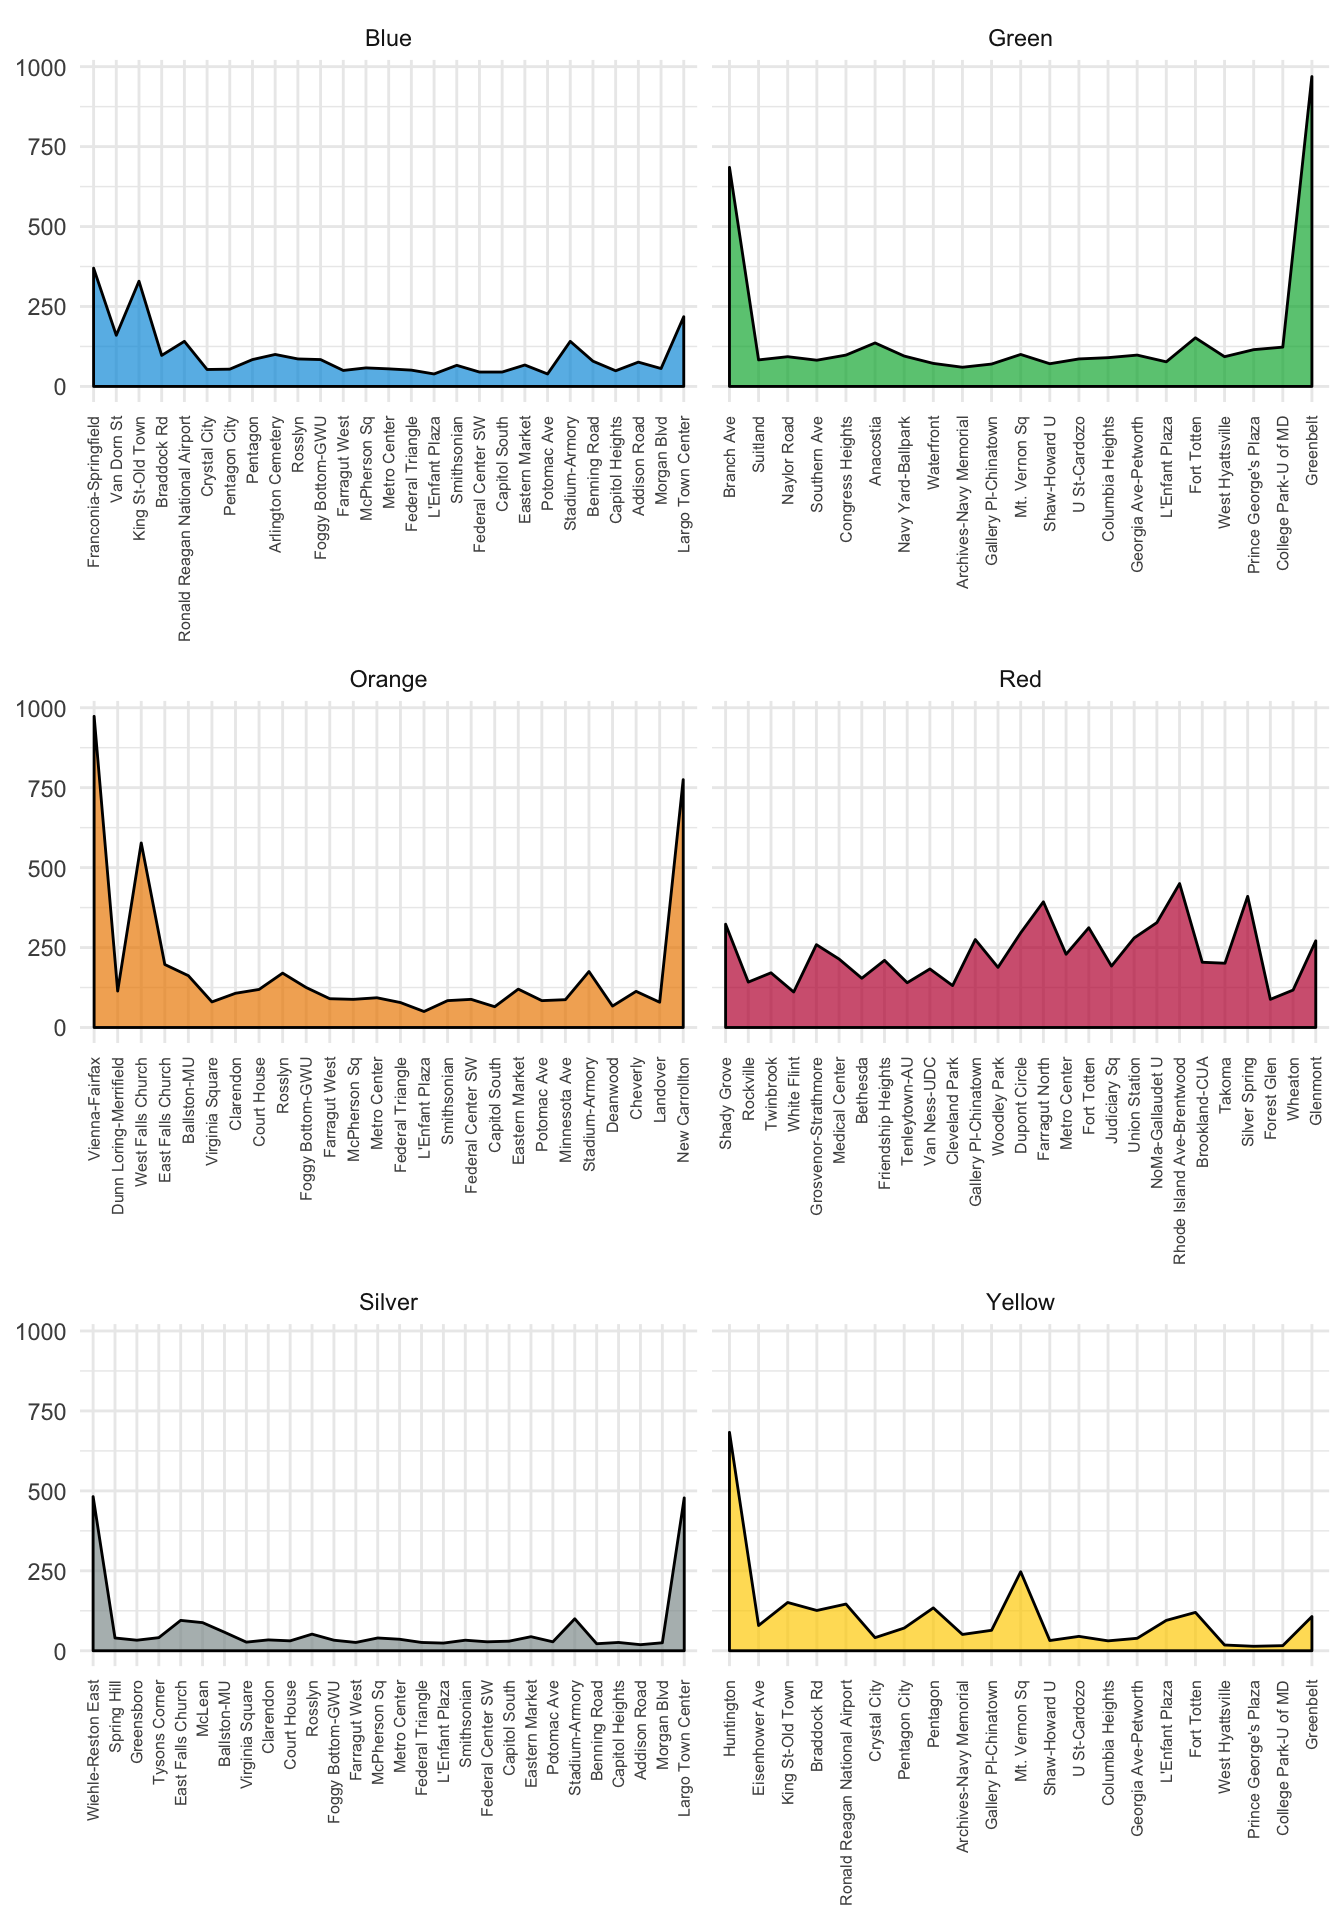
The following graph plots the total issues at each station, ordered by position in their respective lines. For all non-red lines, there are generally more issues at the ends of the lines. This is likely where train delays occur, as trains get held up there for schedule adjustments. For the red line, there appear to be generally high numbers of issues across the entire line.
Seasonal trends
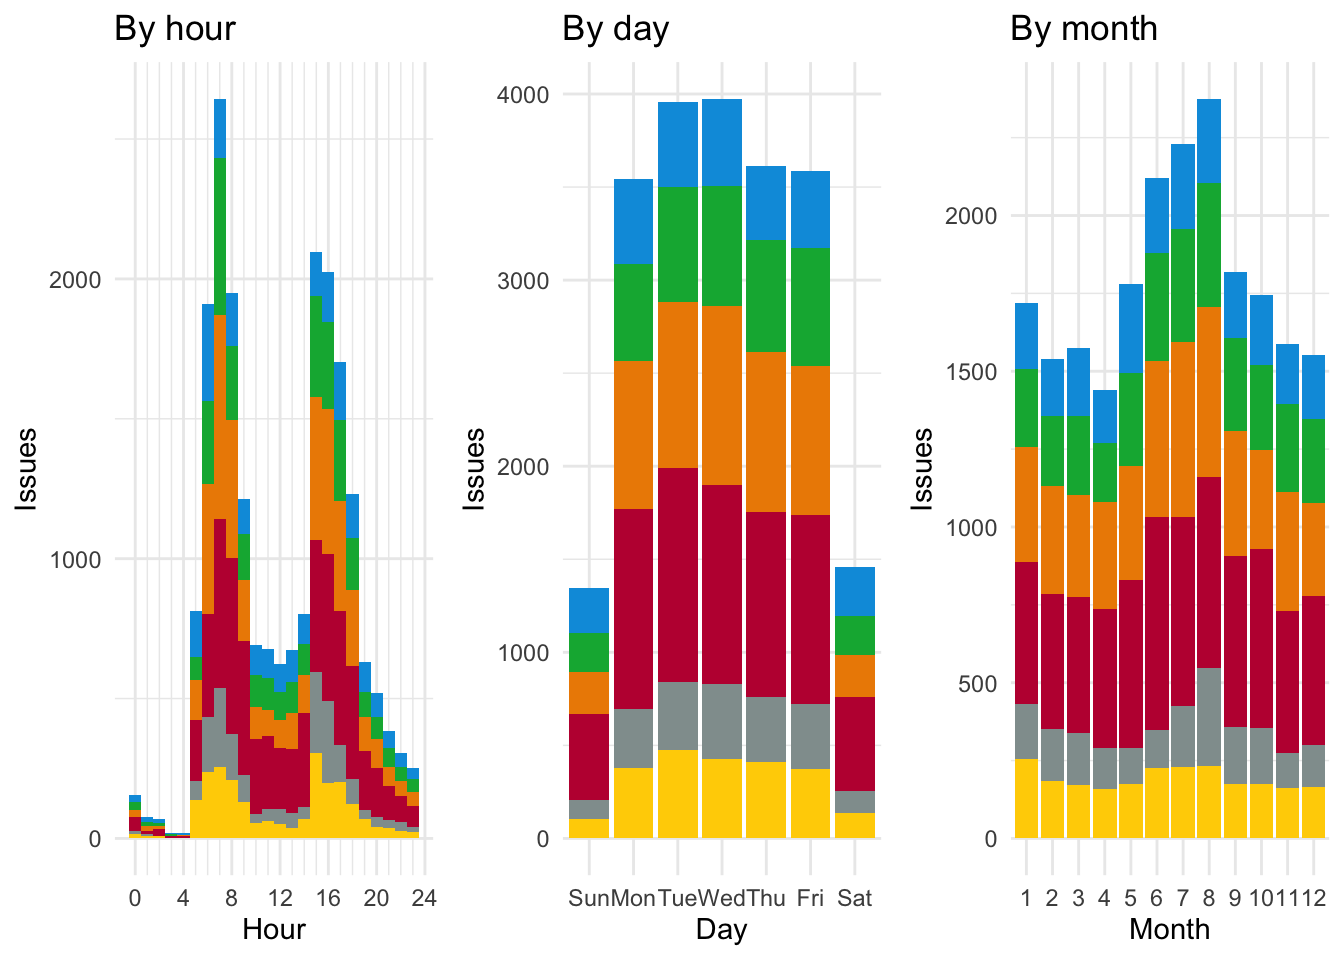
The timing of issues being reported also reveal expected patterns in public transit use, but it’s unclear how much of this is due to the increased likelihood of an issue being reported vs. the increased ridership causing more issues.
The first plot displays issues by the hour in the day they were reported, revealing spikes in issues during peak transit hours. The second plot reveals more issues being reported on weekdays compared to weekends. The third plot reveals more issues being reported in the summer months, presumably when there are more tourists (my anecdotal experience confirms this).