Choosing board games
Board games have been a significant part of my life. Many of my closest friendships were forged through repeated gaming sessions. With my friends from high-school, I progressed from simple gateway games like Munchkin to more complex ones like Power Grid. I’m certainly not alone as a passenger on the board game train.
What makes a good game, and relatedly, what should I play next? BoardGameGeek (BGG) is an online community that helps answer that question with reviews and discussions of almost anything that qualifies as a board/card game. This past week, I found a dataset of 4,999 BGG entries (up to January 2018) scraped by someone on Kaggle.
In the following analyses, I’ll look at a few factors that might be related to a game’s average BGG scores (called geek-ratings), which range from 1 (awful) to 10 (outstanding).
Games over time
The following plot displays the ratings of games over time. Some games did not have specific release dates (e.g., Backgammon and Go, so I visualized games starting from 1981 because that encompassed about 95% of the dataset.
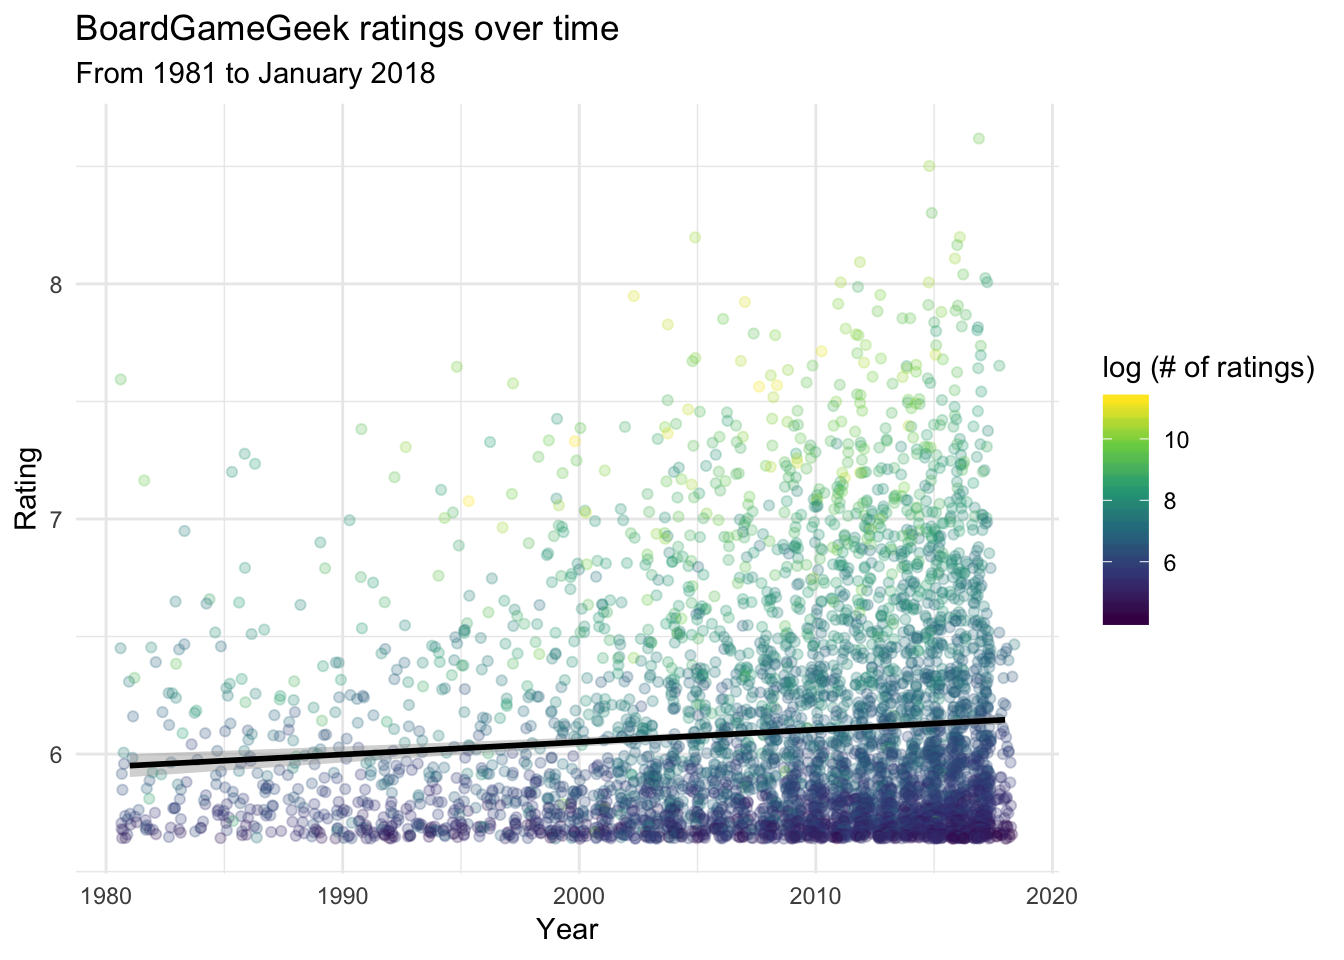
Over time, more games have been released each year. Crucially, games have been getting slightly better on average over time (as can be seen from the positive slope of the regression line).
I also visualized the number of ratings made on BGG for each game. There is a heavy skew in the number of ratings: most games have < 10,000 ratings, but a handful have > 70,000 ratings (Catan is the most popular game, with 77,423 ratings). Thus, I applied a log-transformation to the number of ratings.
In general, games with better ratings tend to have more ratings – the correlation between number of ratings and the geek-rating for a game is moderately strong (r = .64) This is likely because good games attract more players, who then give more ratings (that tend to be favorable). Since BGG is a trusted source of information in the community, this leads to compounding popularity for the best and most prominent games.
Game complexity
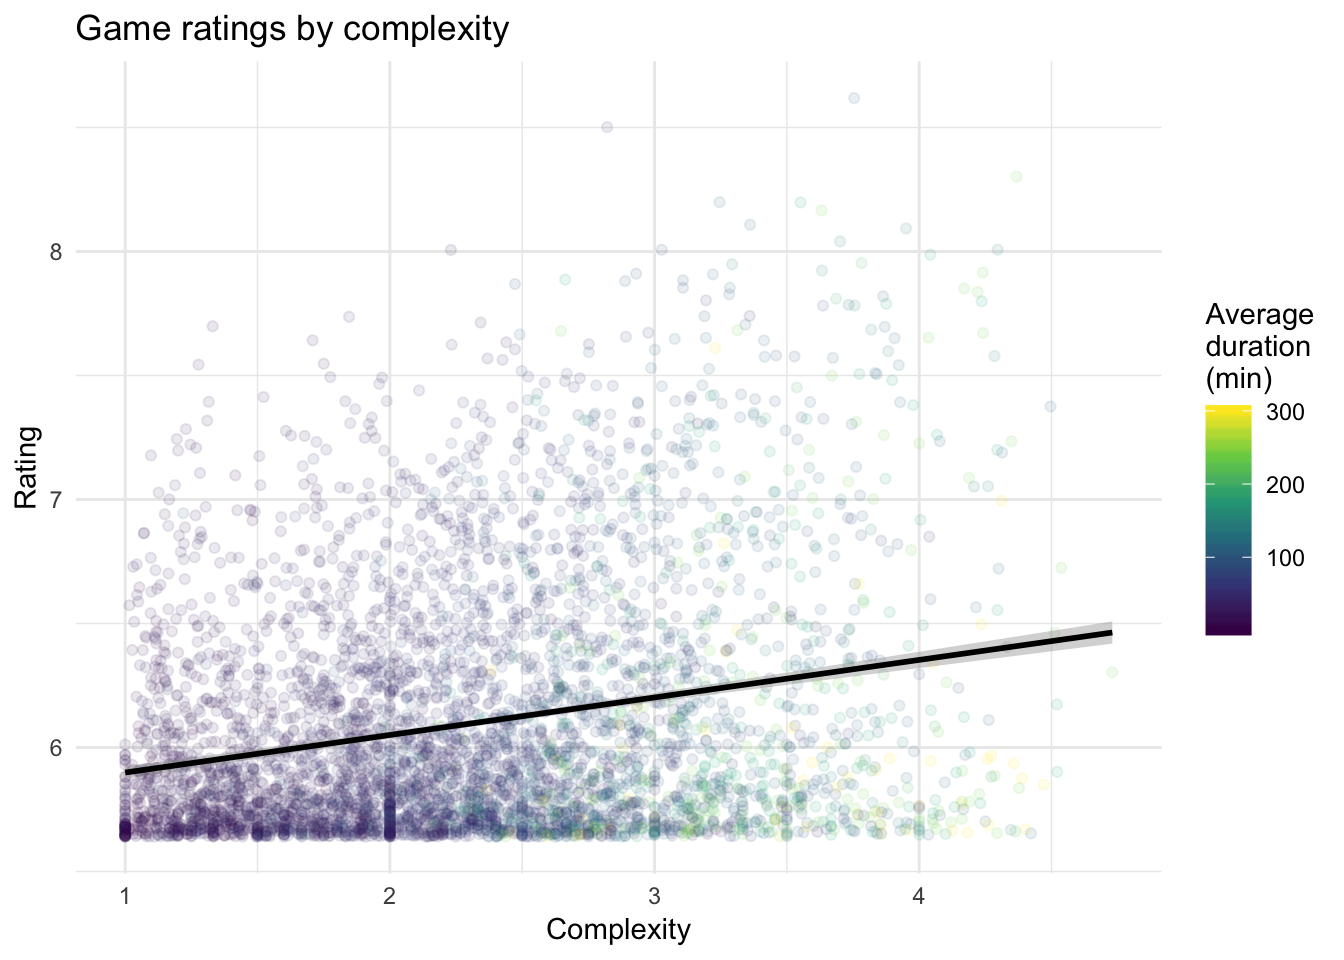
BGG provides a weight for each game to measure its complexity (higher weights = more complex games). The following plot reveals a modest positive relationship between these complexity weights and geek-ratings (r = .20). In addition, games with longer average durations also tend to have greater complexity.
Game mechanisms
Each game utilizes a handful of mechanisms. There is an element of subjectivity to how the use of different mechanisms influences a game’s quality. For example, 116 games in the dataset use a voting mechanism, which I don’t particularly enjoy (because such games typically involve social persuasion: a key weakness of mine). On the other hand, my more charismatic and sociable friends tend to enjoy such games.
There are 51 different mechanisms named across all games in the dataset. Some of these appear in only a handful of games (e.g., 3 games use the singing mechanic, but I’m not sure what that involves). For simplicity, I’ll focus on the 15 most common mechanisms. The following figure plots the use of each mechanism across all games by their ranking. There is technically no limit to the number of mechanisms each game can utilize.
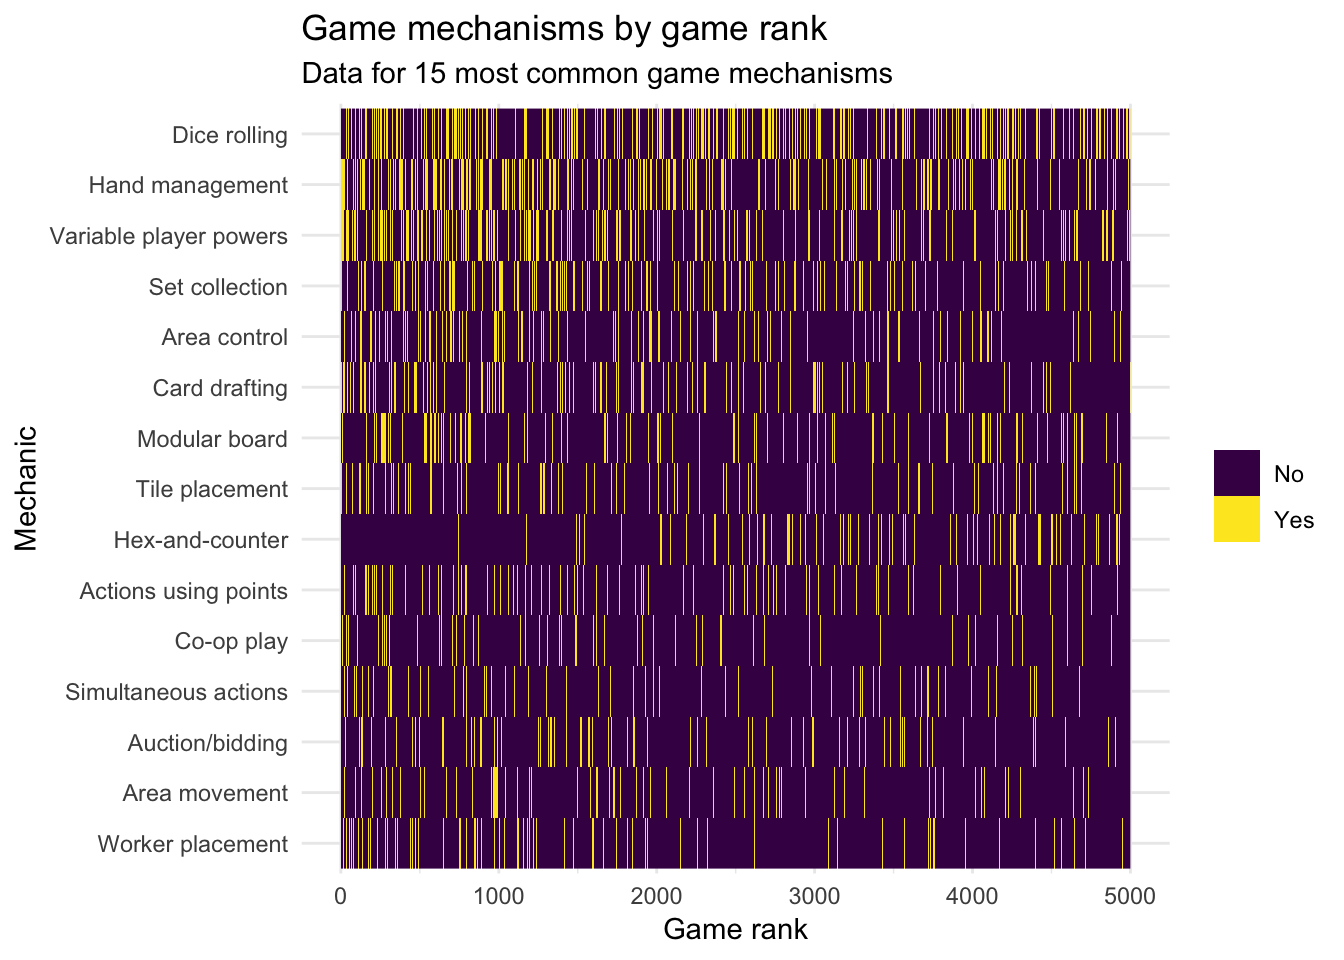
The plot is admittedly difficult to interpret visually. However, it does reveal that the most common mechanism of dice rolling is utilized pretty consistently by games of all ranks. Hex-and-counter, the 9th most common mechanism, actually tends to be missing from higher-ranked games, and is utilized more in games ranked ~2000 or worse. In contrast, worker placement, the 15th most common mechanism, is utilized more by higher-ranked games.
Modeling good games
Putting together the insights from above, I built a regression model to see how well the different features predicted game ratings. I first split the overall dataset into a training set (n = 3999) and a testing set (n = 1000). Using the training set, I fitted a multiple regression model predicting game ratings from all the predictors. The following plot displays the coefficients of each predictor (with 95% confidence intervals).
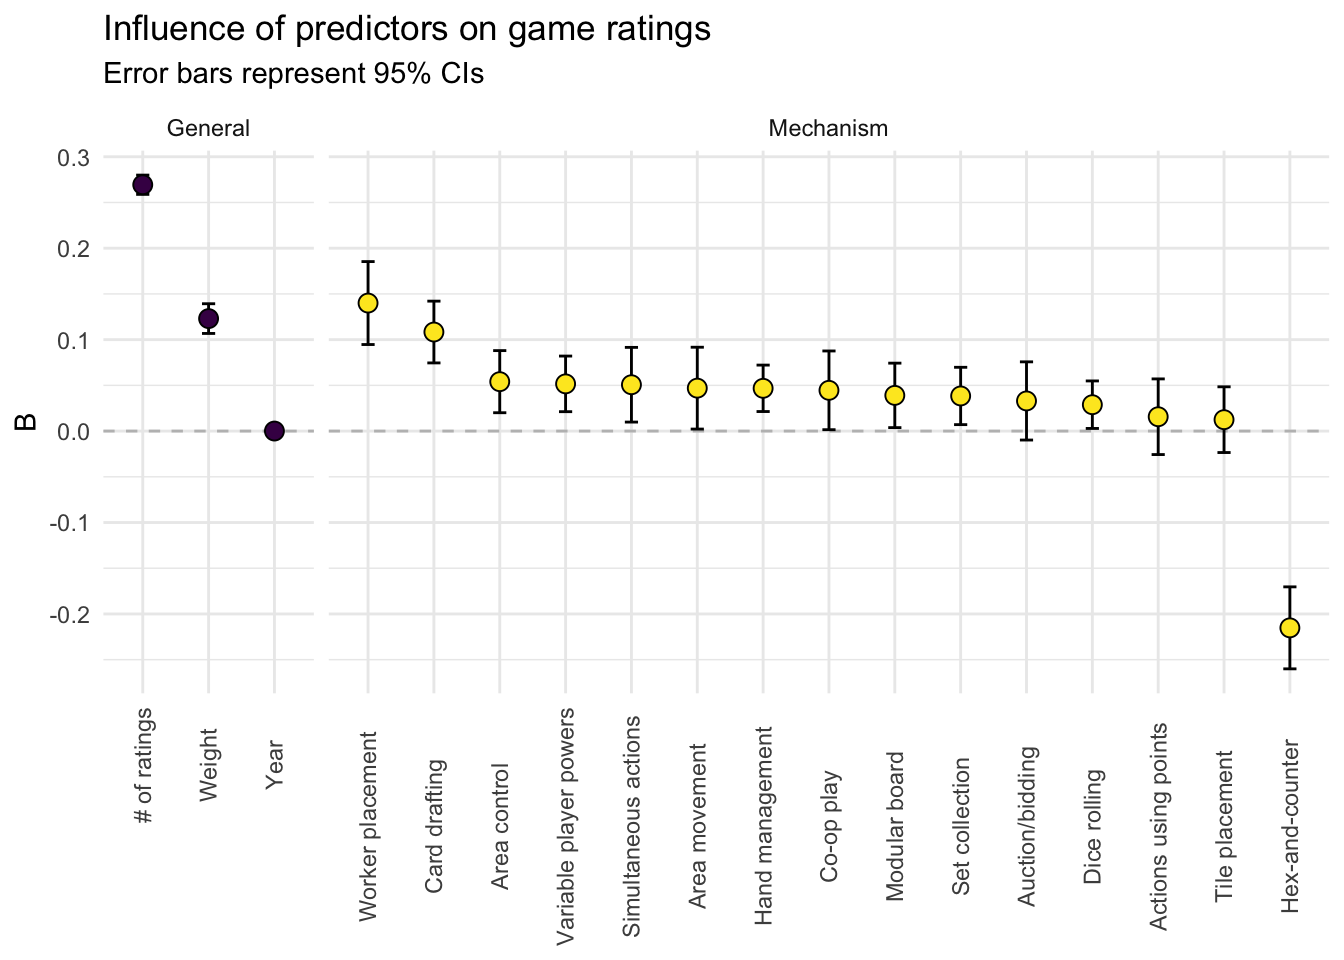
The figure above shows the influence of each predictor while holding all other predictors constant. The # of ratings a game has is positively related to its rating. Because the scale of this predictor was vastly different from the others (ranging from 62 to 77,423), I standardized it – the coefficient (B) indicates that every increase of 1 standard deviation in the # of ratings corresponds to an expected increase of 0.285 in a game’s rating. The weight (i.e. complexity) of a game is also positively related to its rating. For every unit increase in complexity (e.g., comparing a game with weight = 2 vs. 3), the expected rating of the game rises by 0.122 points. Holding other predictors constant, there is no relationship between the release year and a game’s rating.
The mechanisms are either “absent” or “present” in a game. The coefficients indicate the expected difference in a game’s rating when comparing a game without a particular mechanism vs. a game with that mechanism (holding other predictors constant). From the figure, most of the 15 most common mechanisms have a positive relationship with game ratings – worker placement and card drafting are particularly desirable. In contrast, the hex-and-counter mechanism is actually related to lower game ratings (B < 0).
This model accounted for 49.8% of the variation in game ratings. To validate the model, I used it to generate predictions for the testing set – based on the states of all the predictors for a particular game, I used the model to make a prediction of that game’s rating. This yields model predictions for the testing set that can be compared to the actual game ratings.
The correlation between the model predictions and the actual game ratings in the test set was moderately strong (r = .71, equivalent to the model explaining ~ 50% of the variation in game ratings). This very simple model, which only makes use of 15 of the most common mechanisms, does decently well in showing us what makes a well-rated game.
Next steps
For simplicity, I left out many variables that could explain even more of the variation in game ratings. For example, the dataset contains information about game publishers and categories relating to the theme and style of the games (e.g., medieval, space exploration). In addition, a deeper investigation should involve combinations of mechanisms (e.g., actions using points may not be a positive feature on its own, but perhaps in combination with worker placement it makes for very well-rated games).
This post is dedicated to the friends I learned to play Power Grid with all those years ago. Except the one who always intentionally blocked my path.