National Park trails
I love exploring the National Parks. Different parks contain different collections of hikes. I typically choose which park to visit based on a combination of sights I want to see and logistical constraints (e.g., travel time, cost, availability of campsites).
Once I’ve chosen a park to visit, I choose a set of trails to hike based on how much time/fitness I have (choosing hikes with distance and elevation gain within a certain range), with the goal of fitting in as many hikes as possible during my stay. Someone could also take the reverse approach – based on your time and fitness, choose a park to visit with the most suitable collection of hikes.
In this post, my goal is to explore the characteristics of different hikes available across all National Parks. To do this, I scraped crowd-sourced data of trails in National Parks from AllTrails.com in April 2018. This was a challenge – because the AllTrails.com search engine renders content dynamically, I had to use an RSelenium remote browser to access the results.
This data contains all trails the average visitor might reasonably choose to hike. The dataset contains 2,789 trails, with reviews/ratings/check-ins from 81,056 users. Some limitations of this dataset are:
- Some lesser known trails (especially in less-visited parks) aren’t included
- Some trails have overlapping portions, so the total length of trails in a park may be a slight overestimation of the actual length
- Although each reviewer leaves a rating (1 to 5 stars) for a trail, I couldn’t efficiently scrape the exact ratings and only have the rankings of trails within each park
Despite these limitations, there is still enough information in the dataset to answer a few questions National Park enthusiasts may have about the hiking in each park. I’ve merged this dataset with visitation data I scraped from NPS.gov.
Which parks have the most (popular) trails?
Assuming that heavily used trails that are memorable are more likely to be reviewed, the number of reviews for a trail serves as a proxy for its popularity. The following graph plots each park’s number of trails and total number of reviews received for all trails. There is a positive correlation (r = .85) between the number of trails and the number of reviews in a park (the dashed line represents the linear trend).
The parks are categorized into tiers based on total visitors in 2017. Tier 1 consists of the 10 most visited parks, each with over 3 million visitors in 2017 – these are labeled in the graph, and tend to be have higher than average numbers of both trails and reviews. Tier 2 consists of the next 15 most visited parks, each with over 900,000 visitors. Tier 3 consists of all remaining parks, which tend to be clustered in the bottom left corner with fewer trails and fewer reviews.
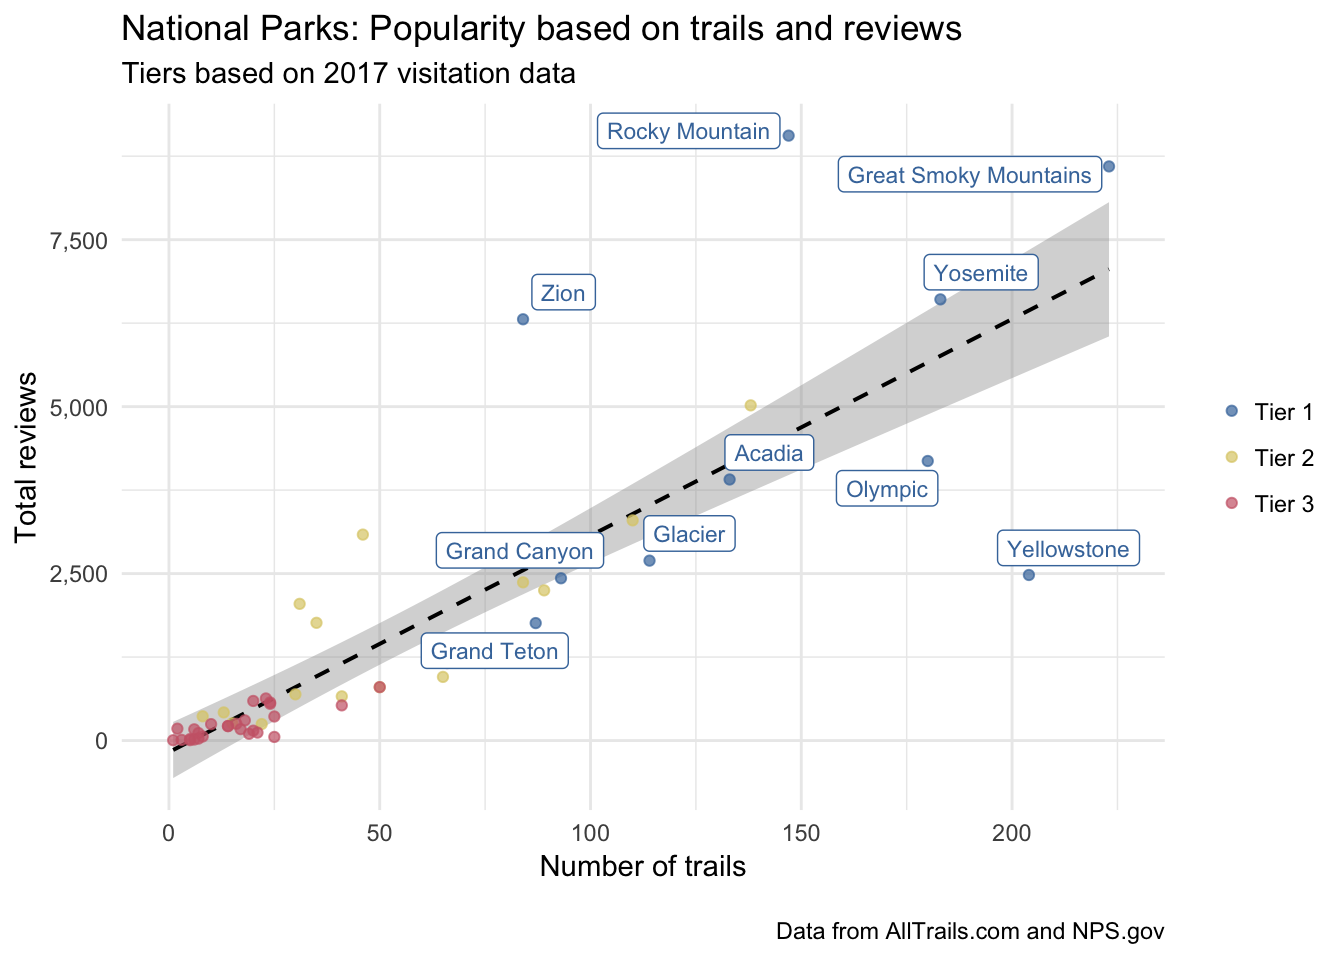
In addition to the overall positive relationship, the graph above also reveals some parks that have fewer total trail reviews than would be expected given the number of trails (e.g. Yellowstone and Olympic). These parks probably have many trails that do not contribute many reviews, or have relatively less people hiking their trails (compared to other parks with similar numbers of trails). In contrast, some parks have many more total trail reviews than would be expected given the number of trails (e.g. Zion, Rocky Mountain, and Great Smoky Mountains), suggesting their trails are heavily used and reviewed. However, this graph does not make clear how the reviews are distributed across all hikes within each park – are all hikes equally reviewed, or are all reviews concentrated in only a few hikes?
The following graph shows the number of reviews for each trail by park. The majority of trails have very few reviews – almost 80% have only 30 or fewer reviews, and just under 7% have 100 or more reviews. However, there are some differences in the distribution of popular trails across tiers.
- In almost all of the 10 most popular parks (Tier 1), there are a significant number of trails with 100 or more reviews. In addition, each of the top 5 also have a handful of trails with over 200 reviews each, including a few extremely popular trails – Angels Landing in Zion has over 1,700 reviews and the hike to Vernal/Nevada Falls via the Mist Trail in Yosemite has over 1,400 reviews.
- The bottom end of Tier 2 and all Tier 1 parks have very few trails with 100 or more reviews.
- Some of the parks in Tier 2 have many trails with 100 or more reviews (e.g. Joshua Tree, Arches, Shenandoah, Mount Rainier), which resembles the bottom half of Tier 1. Perhaps a more appropriate tier system would include the top 5 parks in Tier 1, followed by the next 10-15 parks (containing multiple hikes with 100 or more reviews) in Tier 2.

The graph above shows that the huge crowds in the top few parks are probably casual hikers at best, content to explore a handful of the most popular trails. Some parks contain a few disproportionately popular trails (e.g. Zion, Yosemite, Arches, Shenandoah) while others have trails with more balanced popularity.
Where are the crowds?
How crowded a trail is depends on 1) its popularity, and 2) its length. Comparing two trails with equal popularity, you are more likely to see people on the shorter trail than the longer one. The following graph plots the relationship between the popularity of each park and the total distance of its trails.

There is an overall relationship between the total trail length and number of visitors in a park (r = 0.74), which suggests that people may be choosing which parks to visit based in part on the amount of trails (although this is probably because the amount of trails is correlated with “sights to see”).
Once people visit a park, which trails are the most popular? The following graph plots each trail’s length with the number of reviews. I have excluded trails with more than 500 reviews, as well as those of over 50 miles (primarily for interpretability, but also because those trails are not prototypical for the types of hikes the average visitor might be interested in). There is a negative relationship – shorter trails are generally more popular. You are likelier to hike amongst a crowd on shorter hikes because they are more popular, and because there is less distance for people to be spread out.
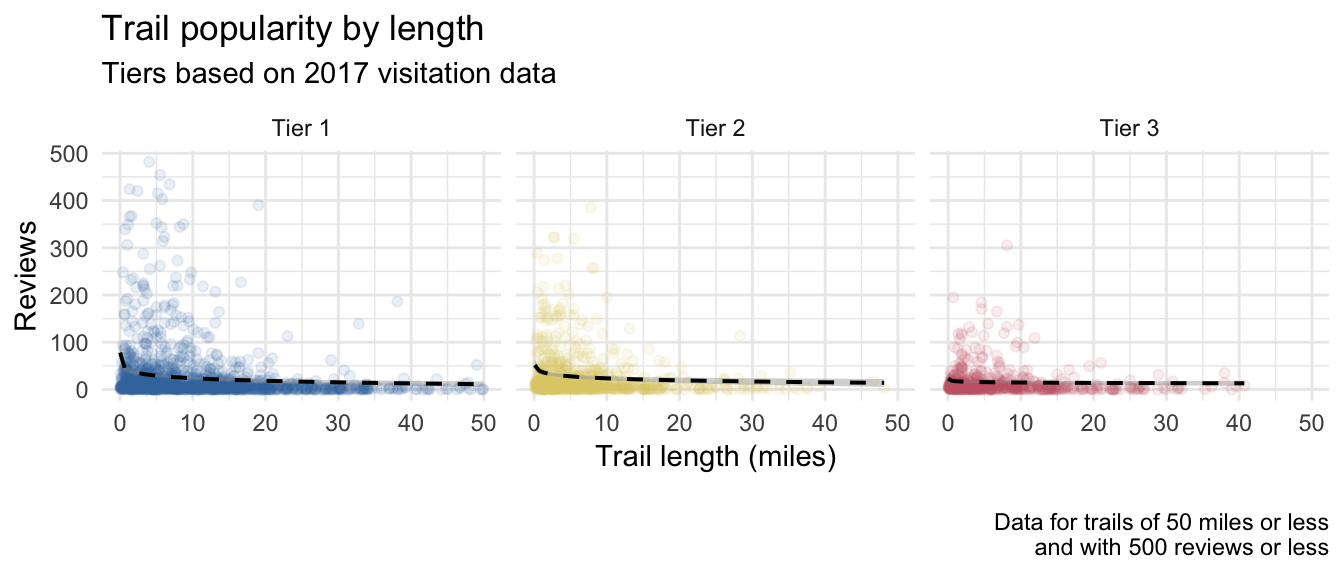
This relationship makes sense – longer trails are more difficult to hike, which reduces the number of visitors who are capable enough to hike a particular trail. However, distance is an incomplete measure of difficulty. The AllTrails.com data also contains the elevation gain of each trail, which factors into a trail’s difficulty.
Which trails are the most difficult?
A trail’s difficulty is a function of its distance and elevation gain (also terrain, but the dataset does not contain that information). The following figure displays each trail’s distance and elevation gain. While there is a positive relationship (longer trails tend to have more elevation gain), the distributions are subtly different. The elevation gains of the trails are more positively skewed, with a larger proportion having minimal to no elevation gain. In contrast, the distances of trails are more spread out. Which are the most difficult trails on the graph?
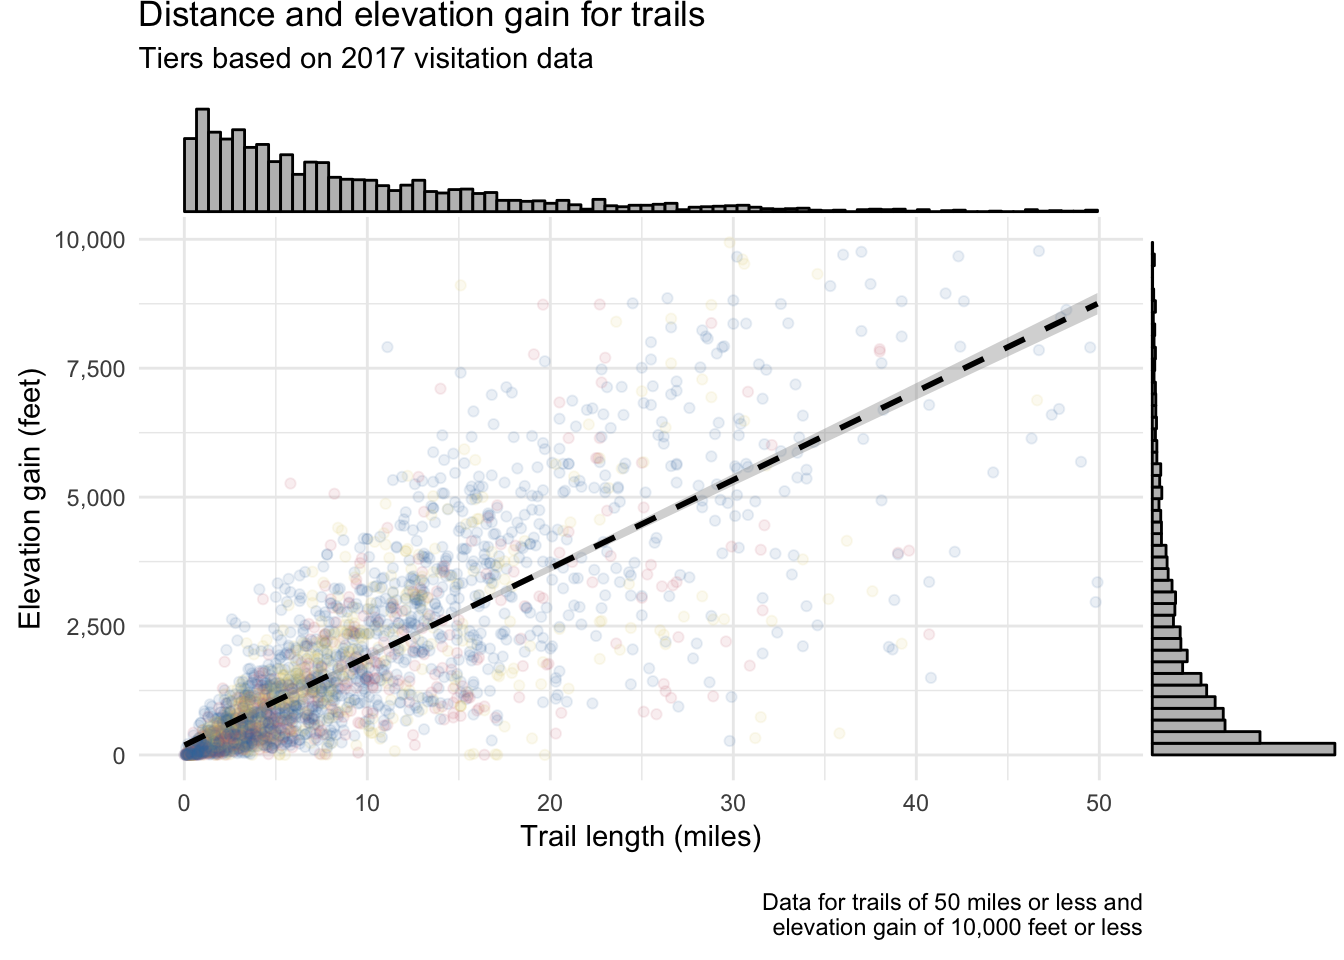
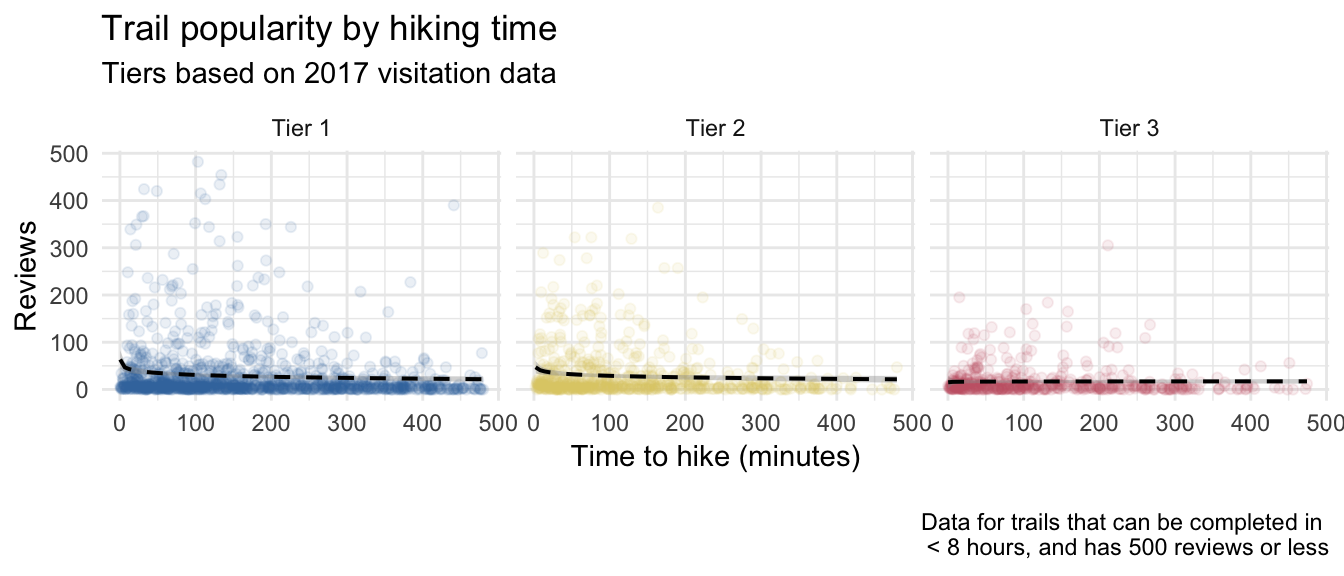
To gain a standardized measure of hiking difficulty, I computed the expected time taken to complete each trail (without stops) based on Tobler’s hiking function. Short trails with extreme elevation gain may be more difficult than much longer trails with only minimal elevation gain. Tobler’s hiking function accounts for the hiking speed someone is likely to reach on terrain of different gradients. Unsurprisingly, there appears to be a negative relationship – easier hikes (that can be completed in less time) are less popular. However, there are still a number of difficult hikes that have a lot of reviews.
If you’re trying to choose a National Park to visit based on the trails you could reasonably hike, the following figure may be helpful – it displays the relative distribution of trails by difficulty (measured by hiking time required based on Tobler’s hiking function). Again, I have included only hikes that can be completed in under 8 hours.
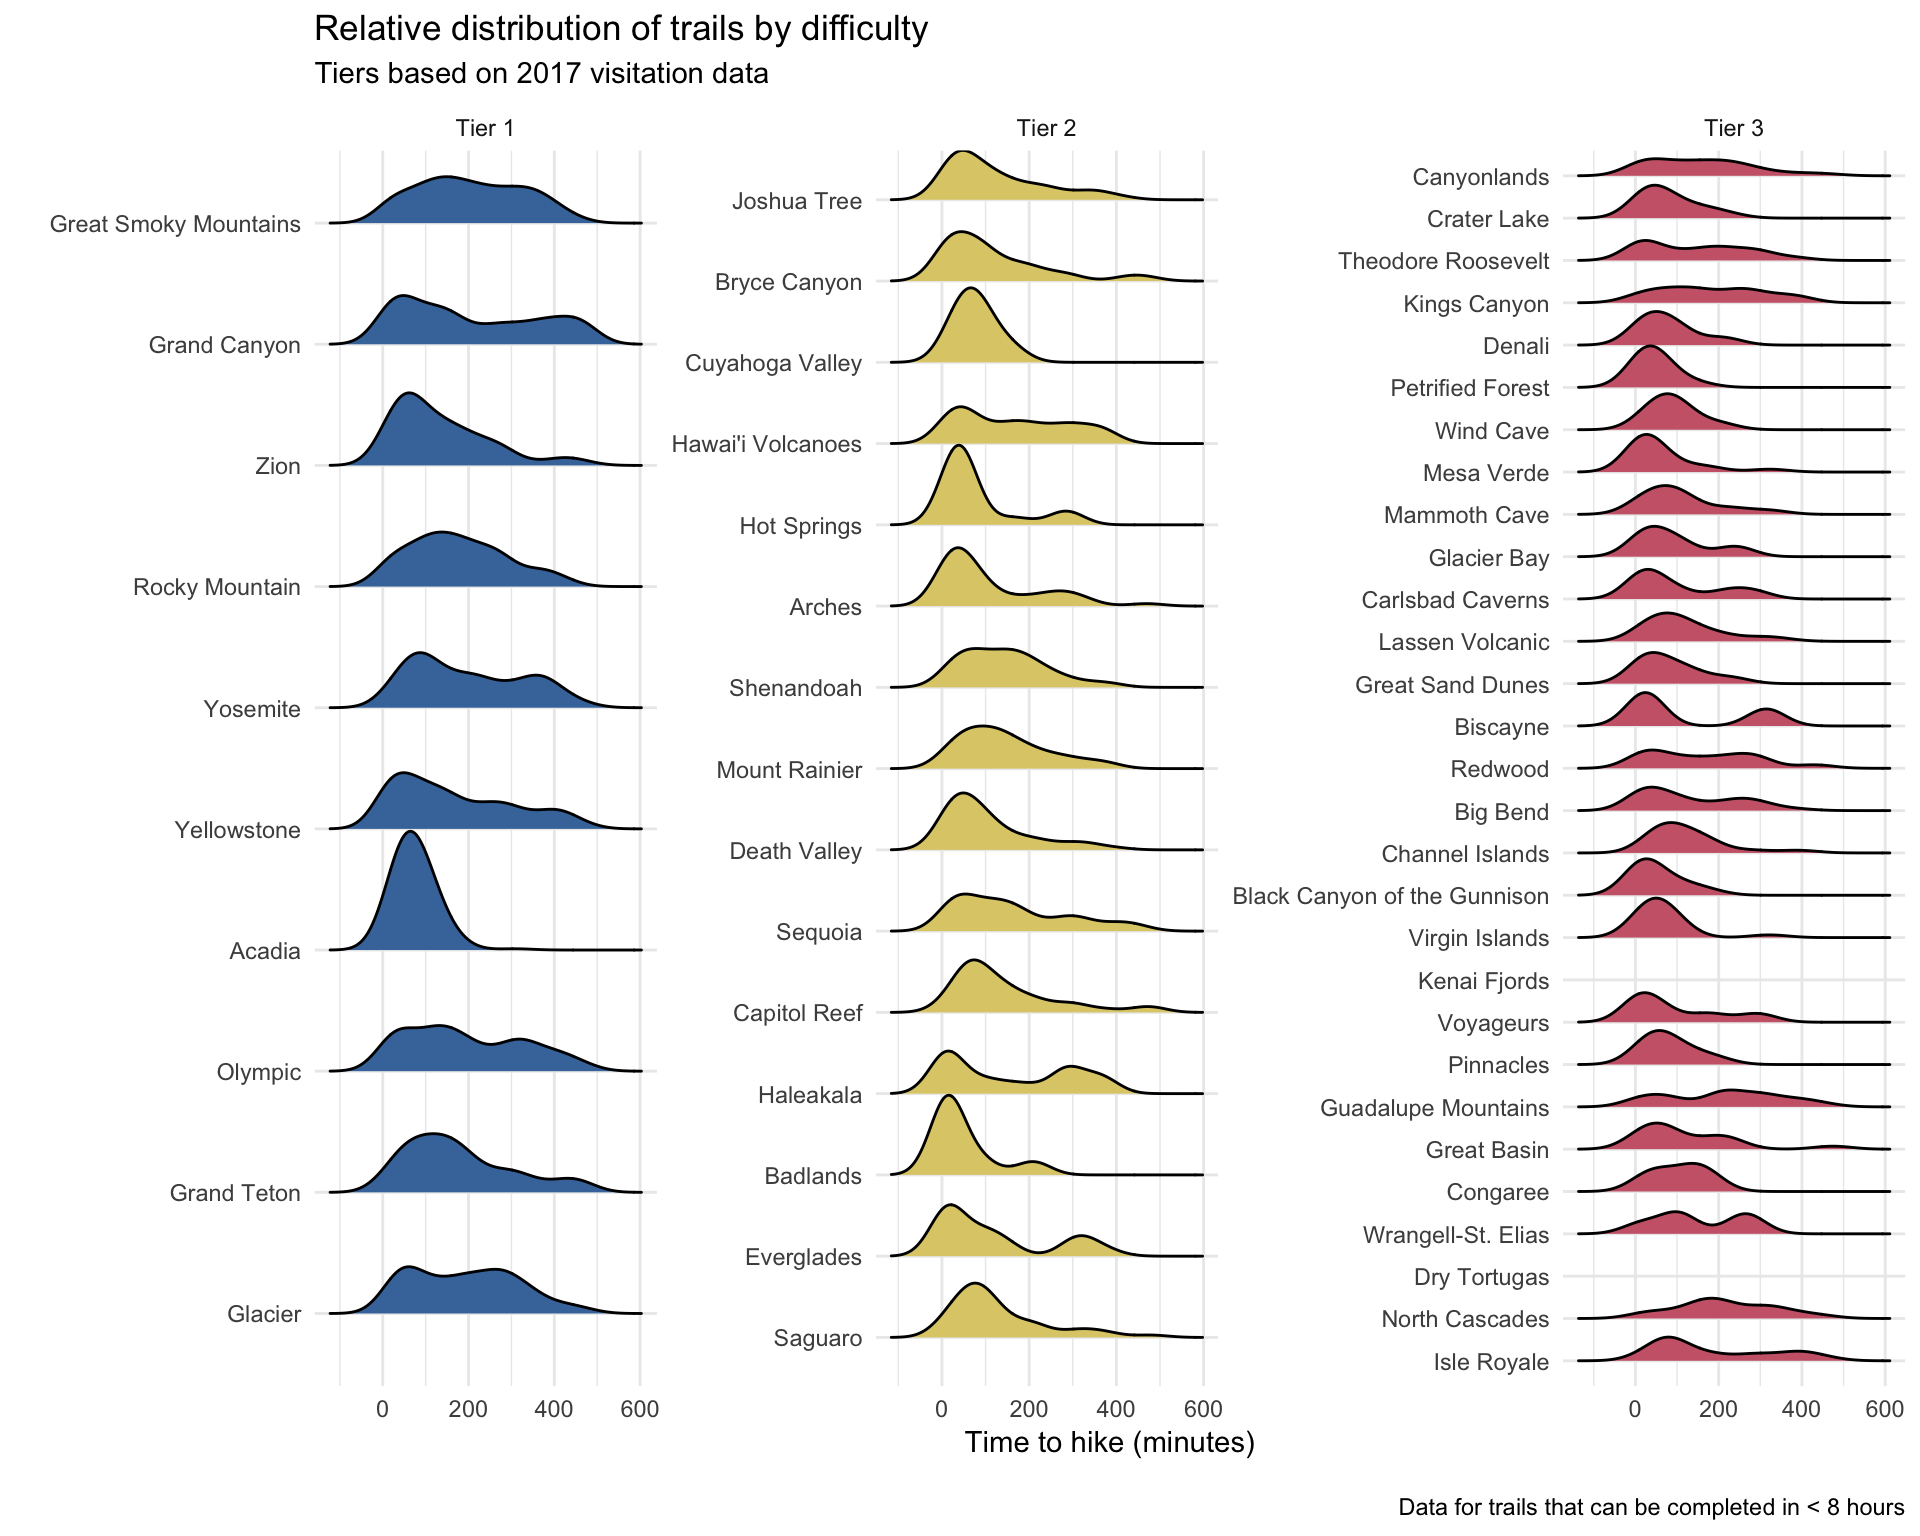
Some parks have trails that are similarly difficult (e.g. most of Acadia’s trails can be completed in between 1 and 2 hours), while others have a greater variety (e.g. in the Great Smoky Mountains, you can hop on a trail of almost any length). Having an idea of the time it takes to hike an average trail in a park can give you an idea of how many hikes you can feasibly fit into a trip.
Get outside
Obviously, the dataset needs to be investigated more specifically to be helpful for planning a National Park trip and choosing the trails you intend to hike (I’m doing this prior to my trip to Sequoia National Park this summer). I’m hoping to create an interactive visualization that could help with this, but these visualizations at least show in principle that there are systematic patterns in the hiking and popularity of America’s National Parks.