The world (is going up in flames)
This song by the late, great Charles Bradley had me wondering: Is the world getting more peaceful, or is it increasingly conflict-ridden? Are there changes in the types of conflicts that flare up today compared to the past? These questions led me to explore the Social, Political and Economic Event Database (SPEED), which contains instances of unrest between 1946 and 2005 (post-WW2). The dataset records 62,141 instances of conflict, with information about time, initiators, targets, sources, and many other interesting variables related to the conflicts.
SPEED distinguishes between several types of events:
- Disruptive state acts. Acts by governments or government agents that disrupt normal societal processes or human interactions. These can include extraordinary acts, the ordinary performance of repressive state tasks, or the failure of government to perform routine duties.
- Political attacks. Actions that injure people or damage property, done for political reasons. These exclude garden-variety criminal acts and acts of war, but include atrocities committed against non-combatants (e.g. rape, mass executions).
- Political expression. When non-state actors publicly articulate messages that are considered threatening or unwelcome by some others. These can encompass a range of issues, from protesting economic or political conditions, to matters concerning the behavior of individuals (e.g. sexual assault).
- Political reconfigurations. Changes in high-level government or national constitutions. These can include failed power transitions (e.g. an unsuccessful coup d’état).
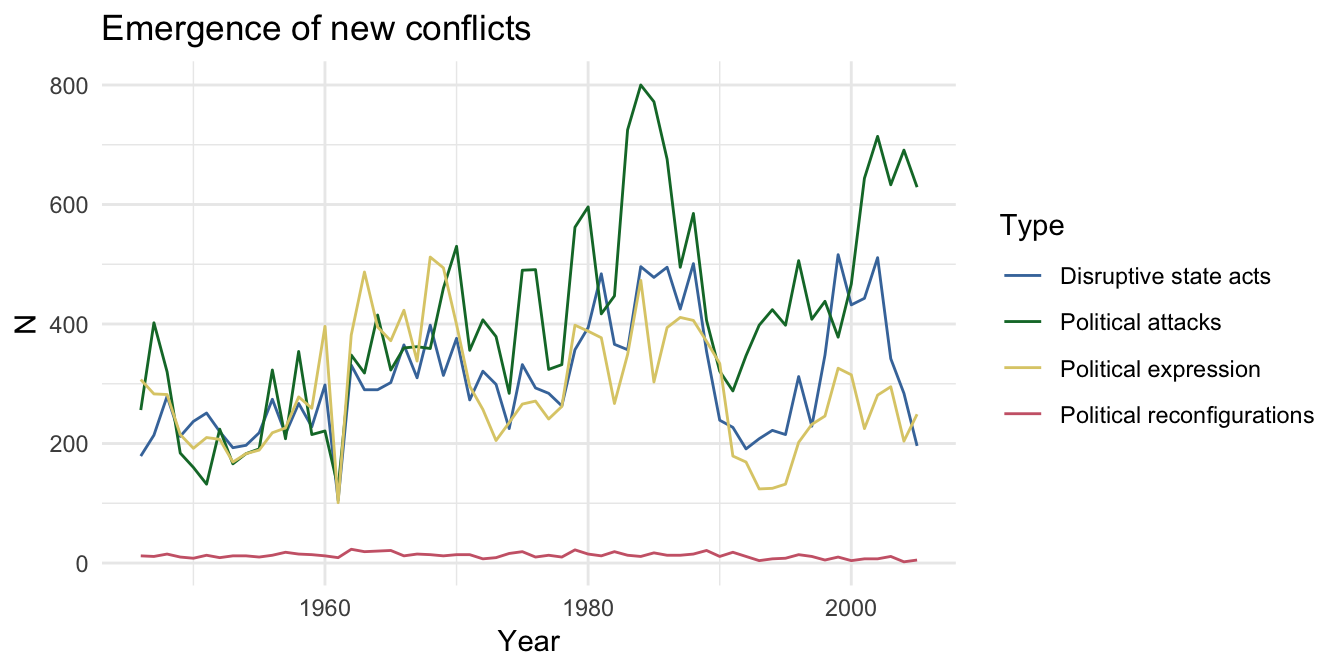
The following graph displays the number of new conflicts of each type that occur each year. Through all the years encompassed by the dataset, political reconfigurations occur at a low rate. The other three types of conflict occur at a much higher rate, but seem to vary greatly by year. Over time, political attacks seem to have become more common in relation to other types of conflict (especially in the 1980’s and post 2000).
Duration of conflicts
The graph above shows only the emergence of new conflicts. However, some conflicts last longer than others. The following table shows the statistics for conflict duration by conflict type. There’s quite a bit of variability in how much each type of conflict lasts on average. There’s also a great amount of variability within each type, but this is due largely to a few conflicts that last an extremely long time (see “Maximum” column).
Duration of conflict (in days) by type of conflict
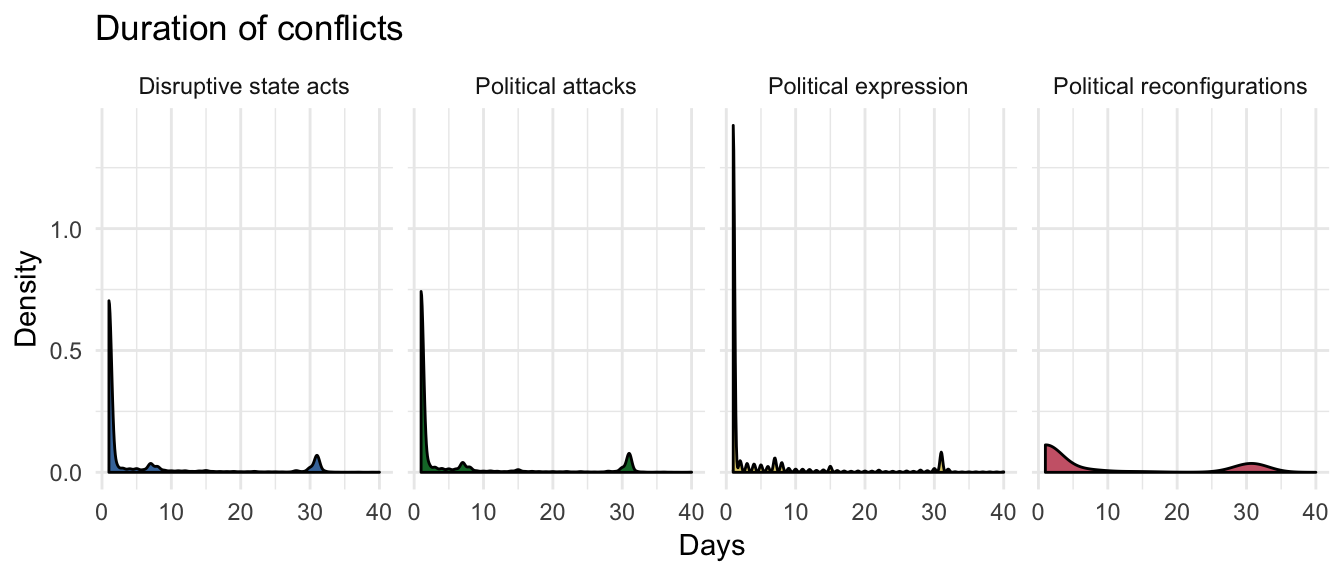
To get a better picture of the duration profile for each type of conflict, I visualized the distribution of durations for all conflicts that lasted 40 days or less (about 17% of the dataset). From this graph, a few things are apparent:
- Most conflicts last only one or two days.
- Disruptive state acts and political attacks have similar profiles. Most conflicts last only a day or two, but there are also small clusters that last around a week and a month long. This suggests there are different sub-types of conflict within each of these types that play out at differing rates.
- Political expression conflicts have durations that are more spread out – there are a few conflicts that last any number of days, especially from two to nine days – in addition to a small group lasting about a month.
- Political reconfiguration conflicts display a bimodal distribution; they all last either less than a week, or around a month.
Conflict across the globe
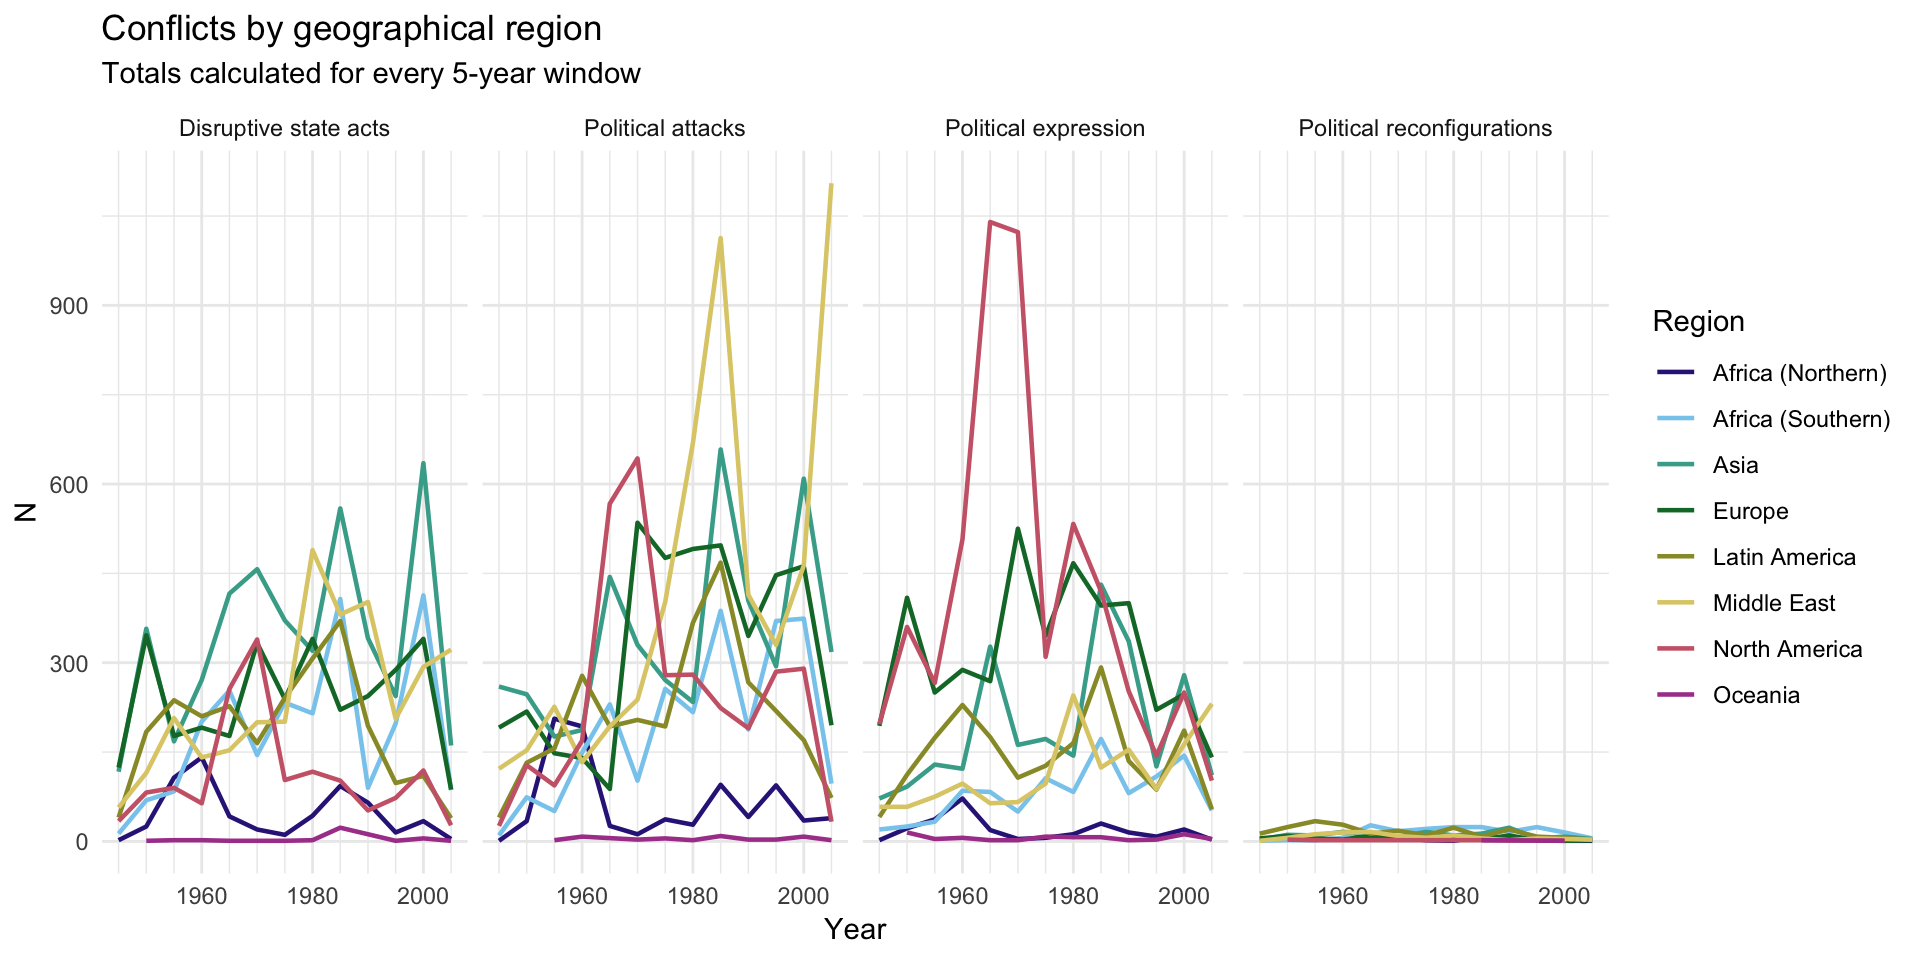
Where do these conflicts occur? The following graph displays the regions that each type of conflict occurred in over time. The counts are computed for every 5-year window, for viewing ease. Consistent with the prior graph, political reconfigurations occur at a low rate across all regions. The remaining three types of conflict reveal differences between regions. A few patterns emerge:
- Oceania had very few conflicts of any kind. Northern Africa also had relatively few conflicts, except for a rise in political attacks prior to 1960.
- The three types of conflicts in North America peaked around the 1970’s, then declined.
- From 2000, conflicts appear to be decreasing in most regions, except for the Middle East. This is especially true when it comes to political attacks. In fact, the overall rise in these types of attacks (see prior graph) seems to stem almost entirely from the dramatic increase in such conflict in the Middle East.
- Aside from the Middle East, the most conflicts tend to occur in Asia, Europe, and Southern Africa.
Victims of conflict
Different conflicts result in different numbers and types of victims. There is large variability in the number of victims (some conflicts are really wars that have affected thousands), so I focused on conflicts with 5,000 of fewer victims. The following graph plots the number of victims who were injured vs. killed for each conflict type.
Most political expression and political reconfiguration conflicts have small numbers of victims. Disruptive state acts and political attacks display the same pattern. Most of those events have small numbers of injured and killed victims, but many have a high number of killed victims (these are probably the most extreme conflicts, for which danger is so great that it results in death more than injury). A smaller number of events have more injured than killed people.

What causes conflict?
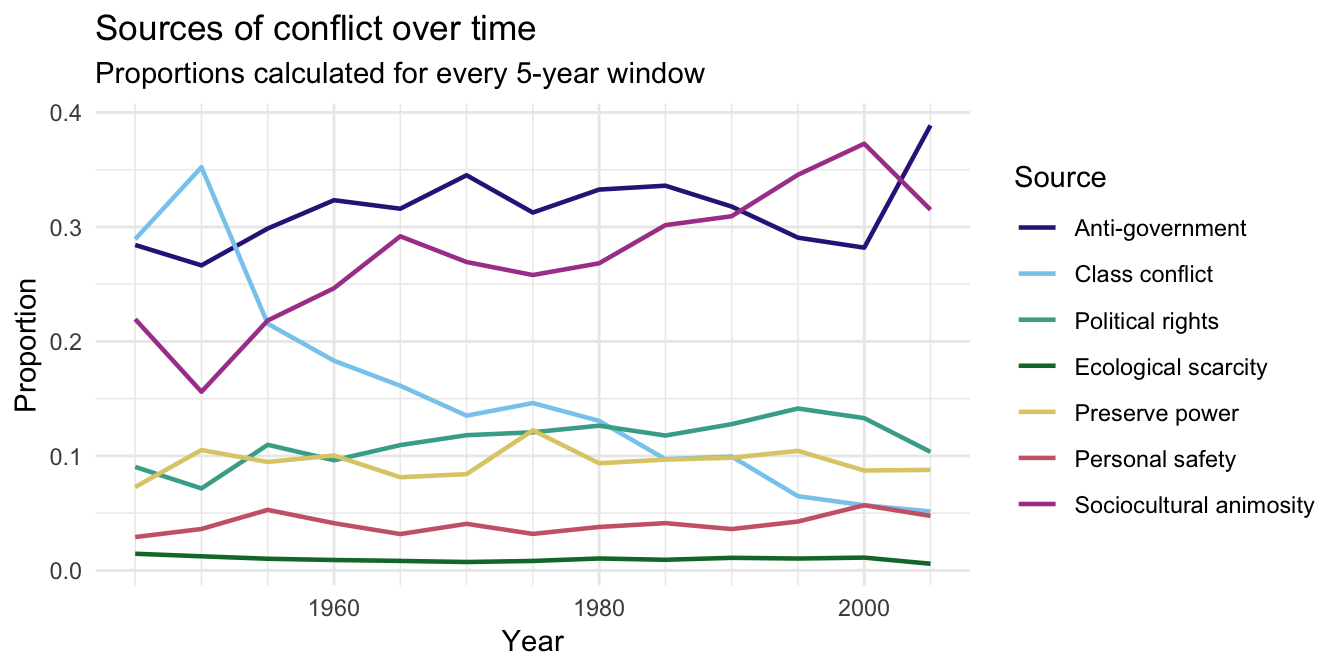
SPEED also records the sources of conflict. The following graph plot the number of conflicts stemming from each source over time. Some sources of conflict are more prevalent (e.g. anti-government sentiment) than others (e.g. ecological scarcity). Over time, each source of conflict has led to consistent numbers of events, except sociocultural animosity between groups (on the rise) and class conflict (thankfully, on the wane).
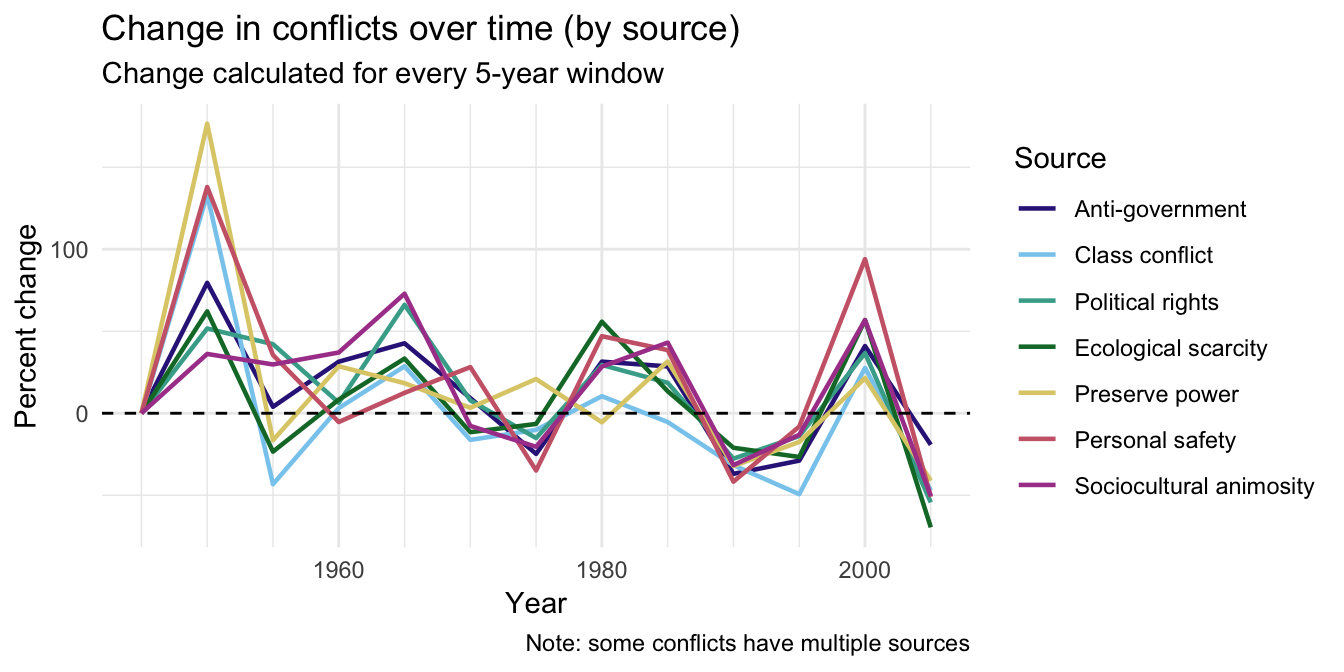
A more fine-grained look at how conflicts change over time can be obtained from plotting the change in the percentage of conflicts compared to the prior time point. The following graph shows the change in the number of new conflicts due to each source over time, and reveals that conflicts increase and decrease in a 5-10 year cycle. The data only goes up to 2005, but it will be interesting to see if this cyclic trend continues.
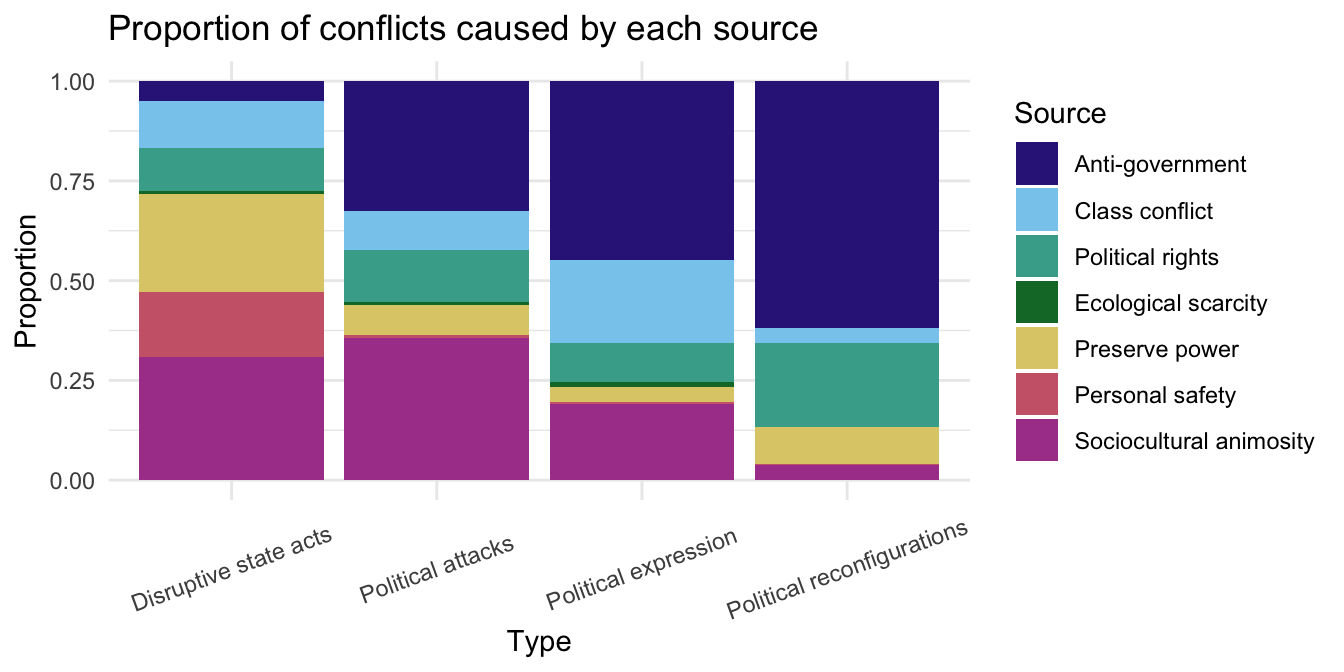
Different sources of conflict should lead to different types of conflicts. The following graph plots the proportion of conflicts of each type that are attributable to each source. A few things of note:
- Disruptive state acts are caused by a wide range of factors, but not typically by anti-government sentiment, presumably because the acts are carried out by the state itself. The few instances caused by anti-government sentiment are cases of inter-governmental conflict (e.g. a local government rebelling against a federal government).
- Political attacks and political expression have the most similar causes, except that the former is driven more by sociocultural animosity.
- Political reconfigurations are unique in that they caused mostly by anti-government sentiment and exerting political rights.
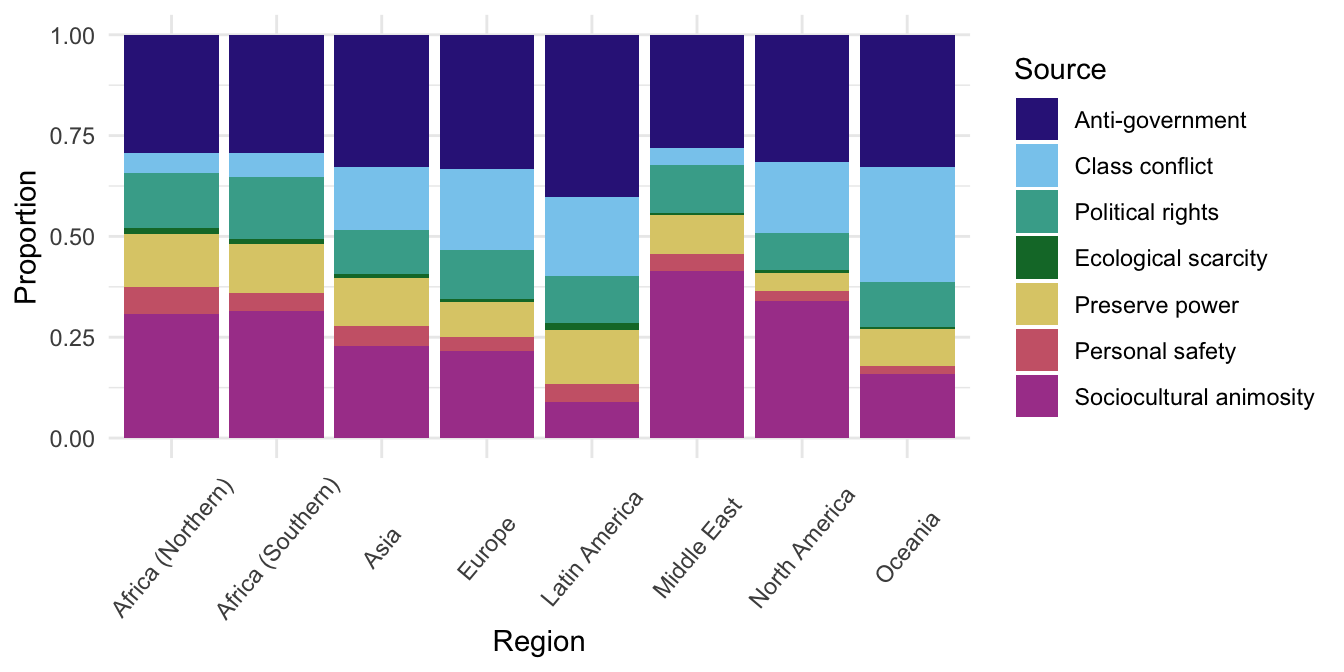
Conflicts in different regions may also have different sources. The following graph plots the proportion of conflicts in each region that are attributable to each source. There appears to be a general trade-off between anti-government sentiment and sociocultural animosity – Latin American conflict is caused most by the former and least by the latter, and this pattern is reversed for the Middle East.
Conclusion
These visualizations are intended to give a broad overview of the kinds of information contained in the SPEED data. More complete and complex data containing information about the specific conflicts could reveal more interesting phenomena. For example, are there different latent classes of conflicts? Are some conflicts caused by some prior conflicts? In future analyses, I’ll try to answer some of these questions, without falling into a pit of despair over the state of the world.