National Park visits
Last year, the National Park Service celebrated its 100th anniversary. I’ve had the privilege to camp at several of them in the last few years (you can see photos I’ve taken on some of my travels here), and I’ll be going to Rocky Mountain National Park in Colorado this Summer.
Growing popularity
I think the National Parks are the greatest thing America has to offer. It seems many people agree – visitation has never been higher. While I love being outdoors in these amazing spaces, I hate crowds more than anything. I downloaded visitor statistics from the NPS to get an idea of which parks were most popular. While it’s too late to change my Rocky Mountain plans, maybe this can help you know which ones to avoid in the future (if you’re as averse to crowds as I am).
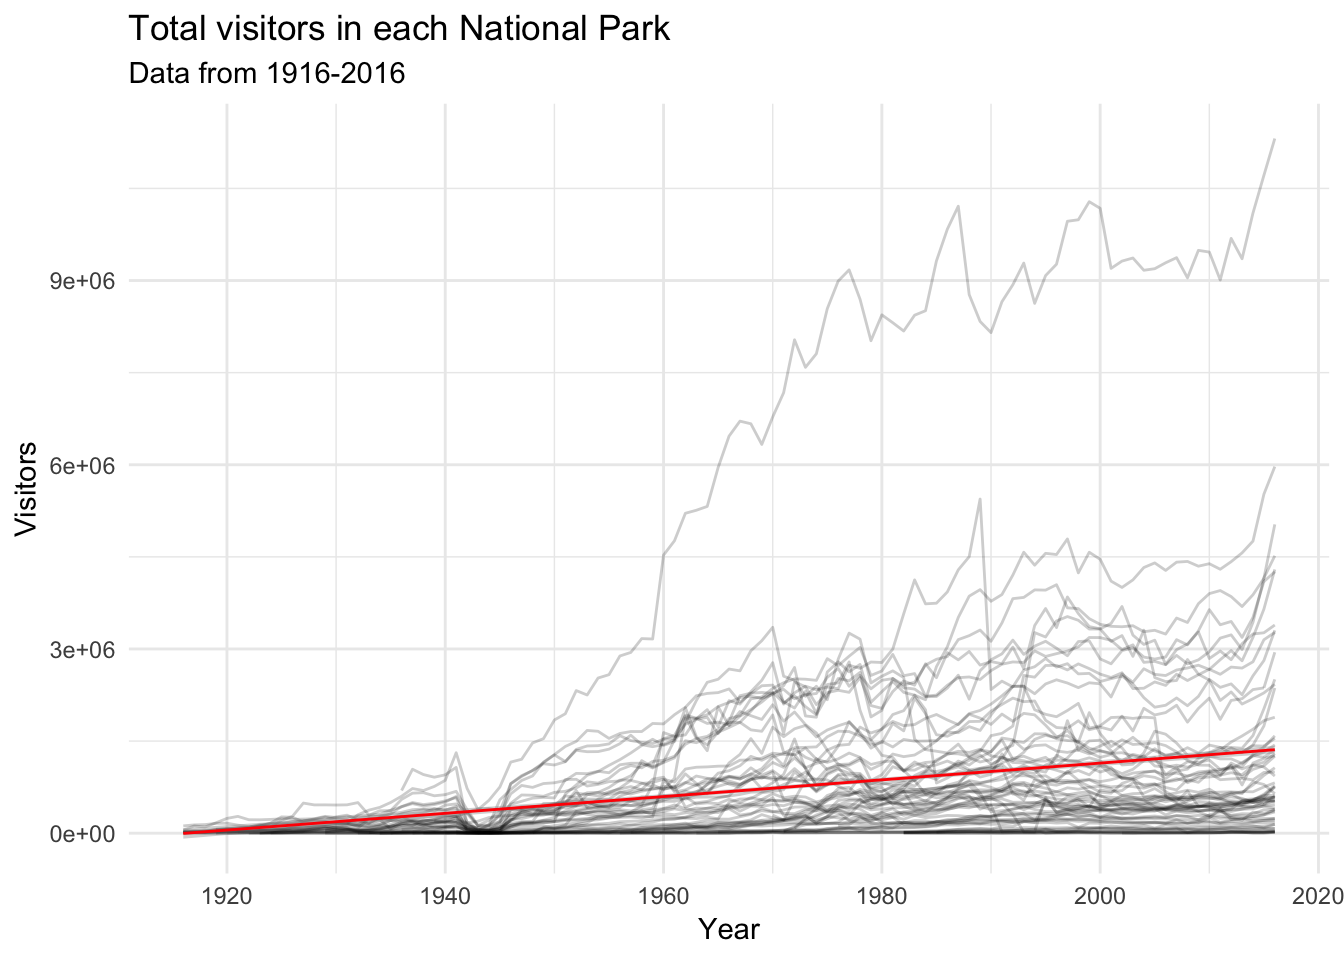
The following graph plots the number of visitors in all 59 parks between 1916 and 2016, showing a clear increasing trend.
Does this increasing trend apply across all National Parks? The following graph plots the average change in the proportion of visitors from year to year for each park (an average change of 1 means a 100% increase in visitors each year). Almost all parks have an average increase in the proportion of visitors across all years – the average for all parks is an average increase of 15% per year.
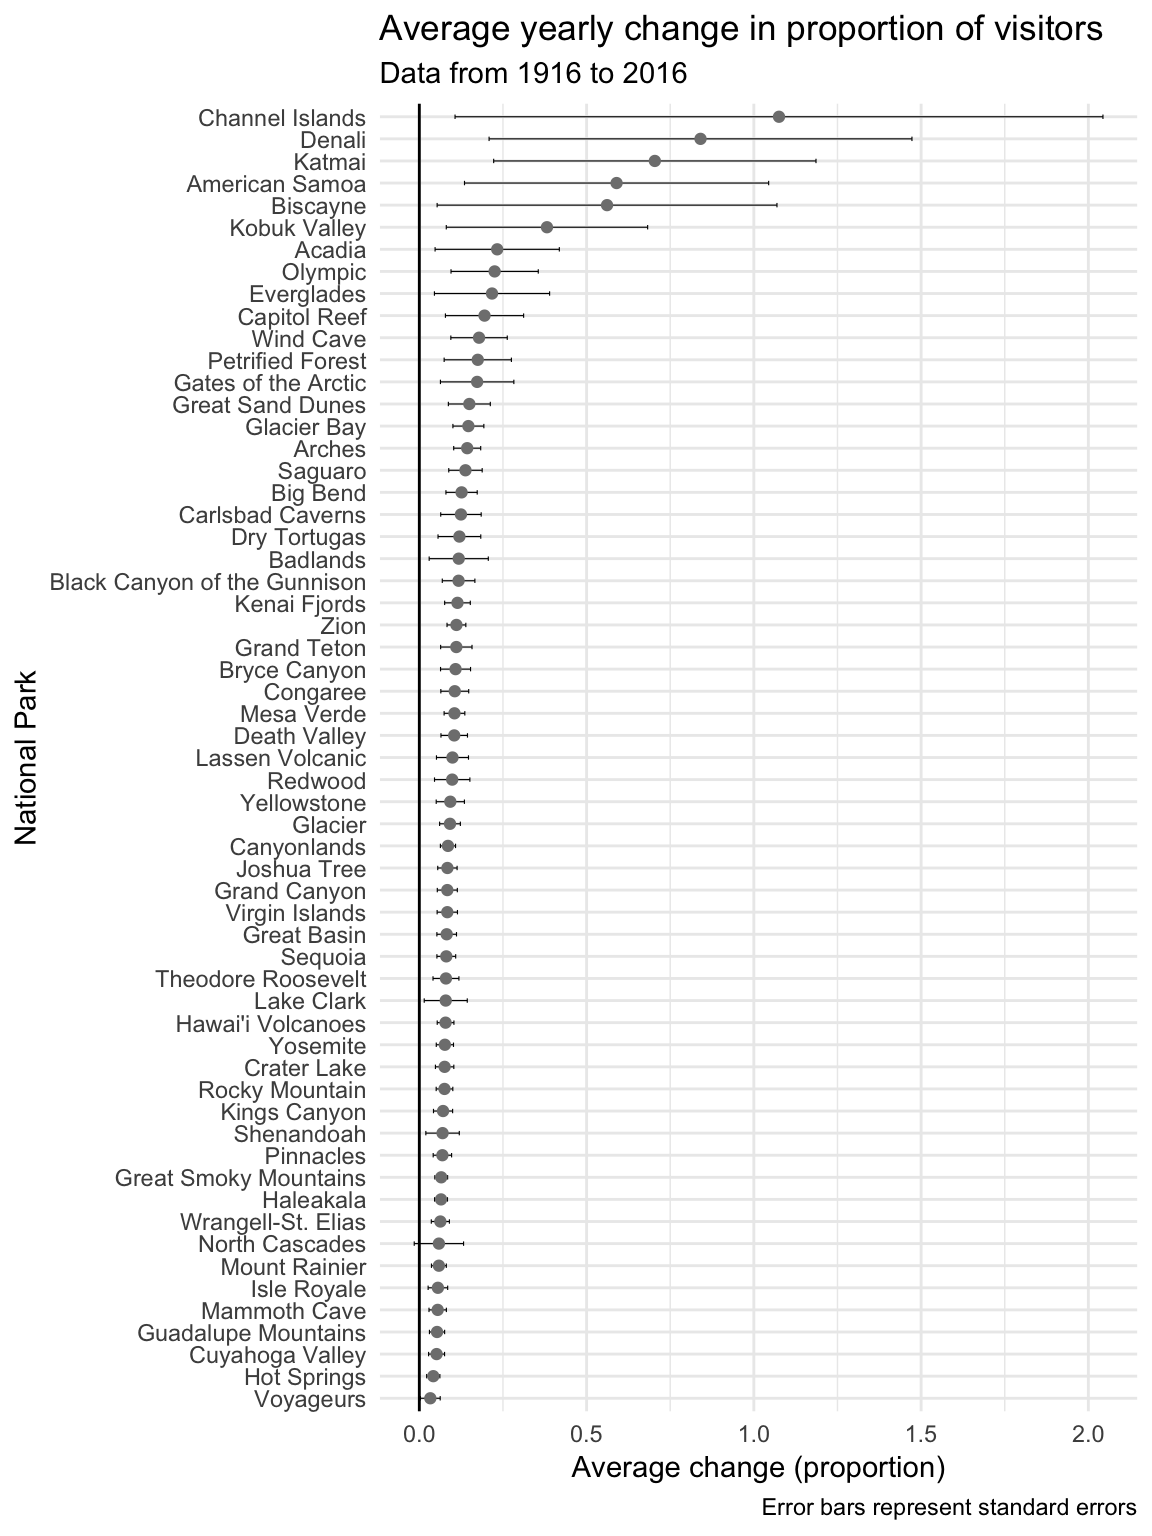
The parks with wider error bars typically have fewer data points or a few outliers. For example, Channel Islands National Park had an increase in visitors from 300 in 1966 to 15,700 in 1967 (a 513% increase). The graph shows that different parks are attracting visitors at different rates. While I hope to one day make it to Channel Islands National Park, it was only the 43rd most visited park in 2016 (out of 59), and not quite in the same league as the big-hitters.
The Big 10
In 2016, the top 10 most popular national parks accounted for 58.25% of all national park visits! These big-hitters are the most famous parks that I’d bet most people could name. The next graph plots the visitor share of these 10 parks (out of all visitors to all national parks) between 1916 and 2016.
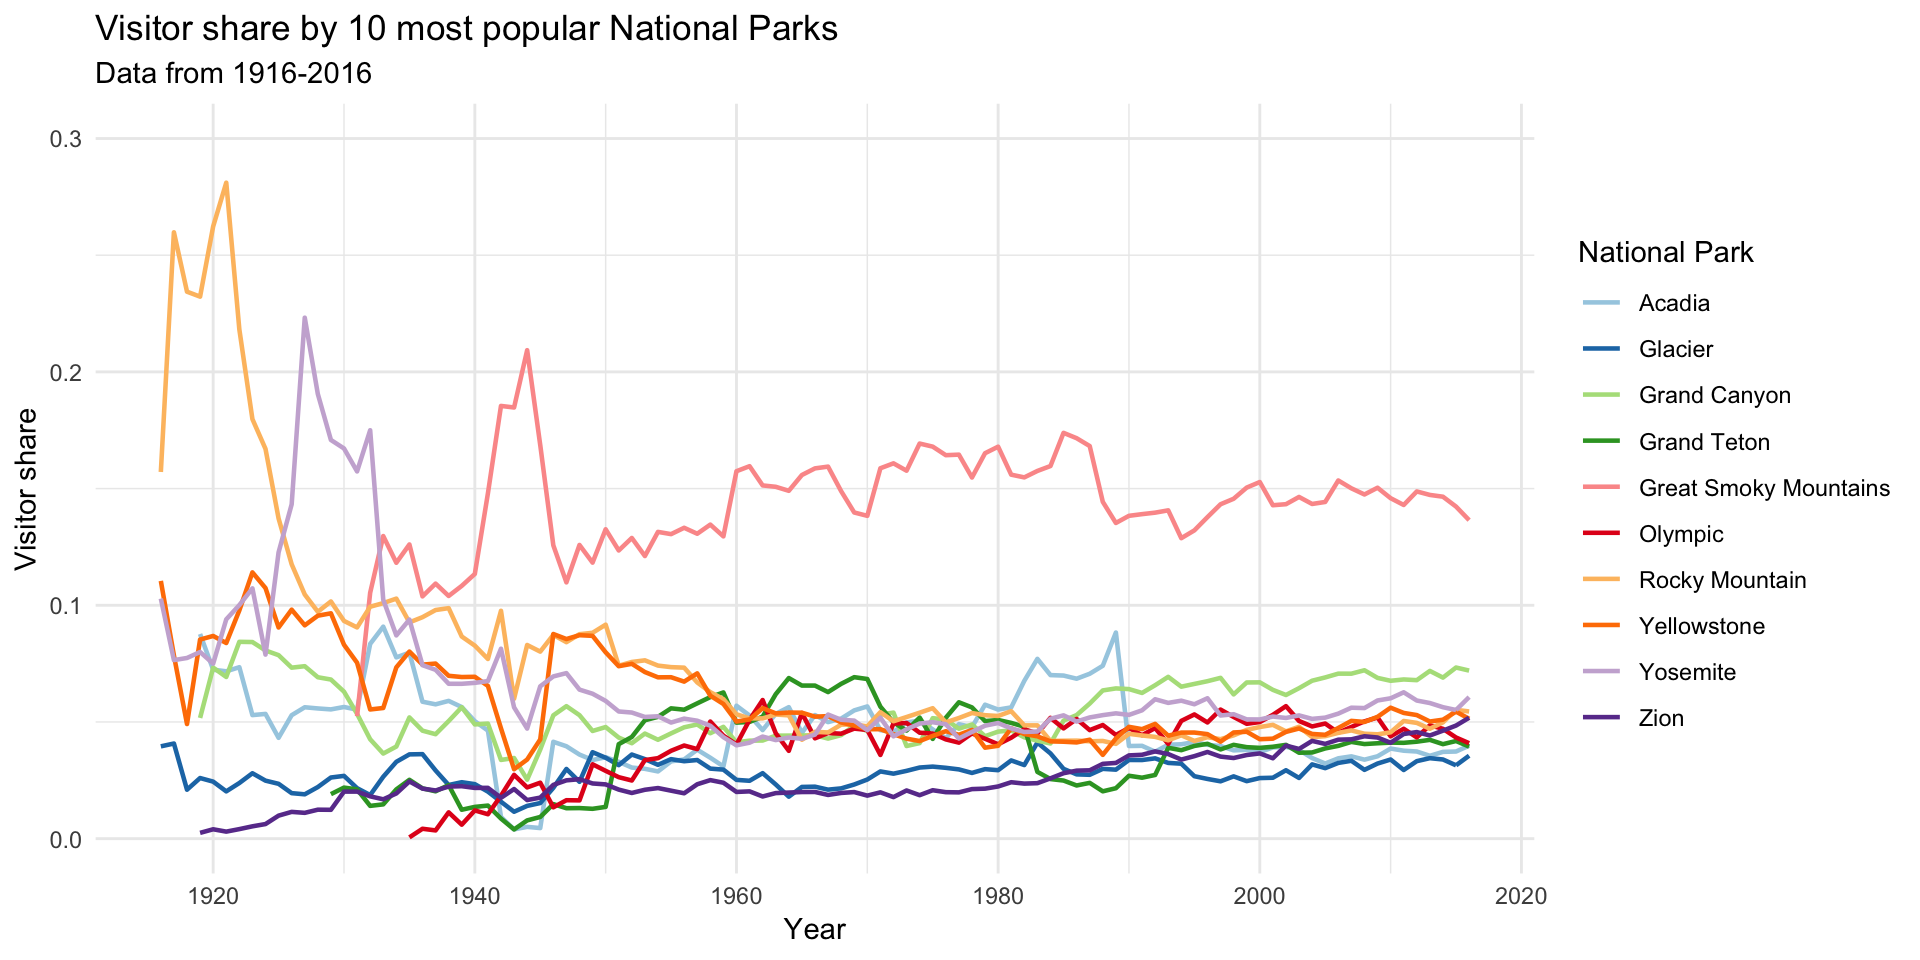
Before the mid-1920’s Rocky Mountain National Park had the largest visitor share by far (more than 25% of all national park visitors). It decreased over time, but has remained consistently in the top 10 (it was 4th in 2016). Yosemite had a surge around 1930, then settled in as a Rocky Mountain competitor. From the mid-1930’s, one park came to the fore and has been unrivalled ever since: Great Smoky Mountains National Park. In 2016, it accounted for 13.6% of the visitor share, almost double the second-placed Grand Canyon at 7.2%.
The likeliest reason for this is its accessibility and distance from the other national parks. The following graph plots the visitor share for all parks (with the Big 10 highlighted) by region.
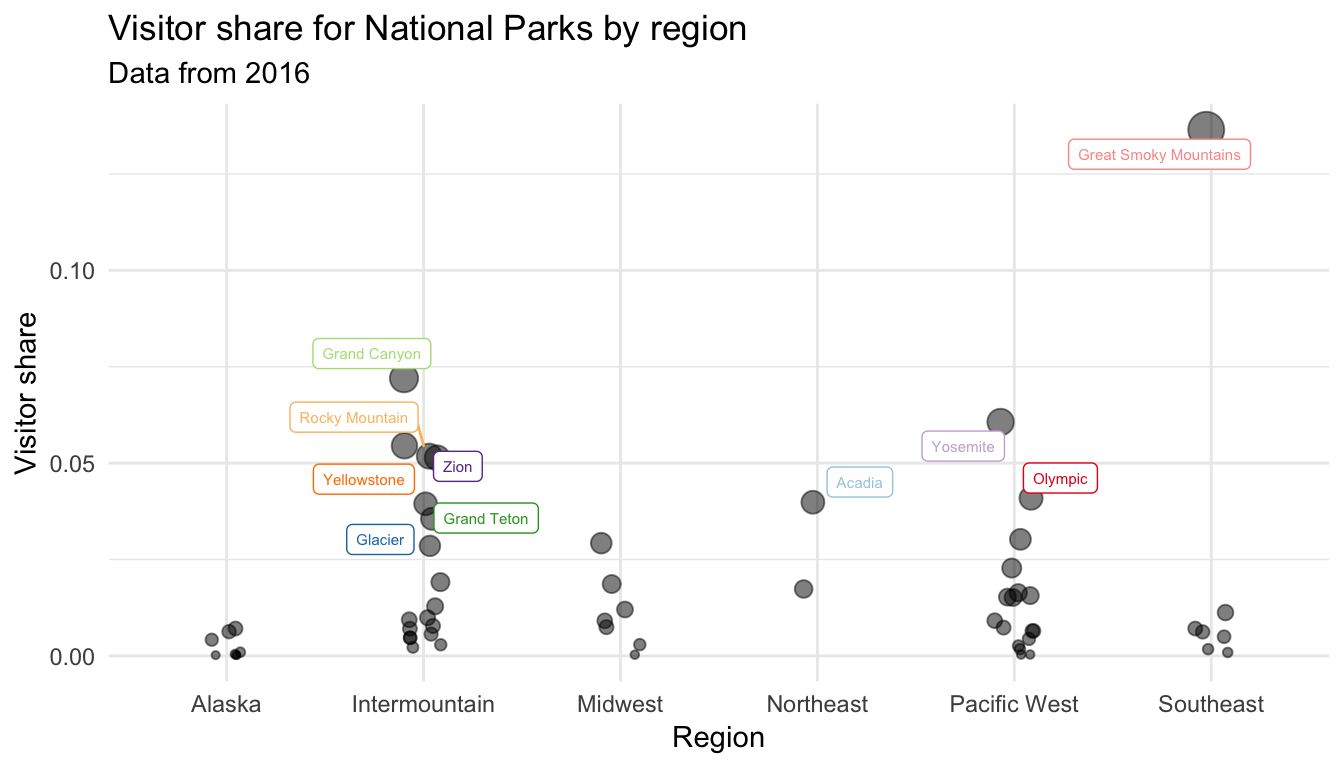
Most of the Big 10 are from the Intermountain region, which covers states in the middle of the country. The Pacific West region has two Big 10 parks (Yosemite in California, Olympic in Washington). Those parks are distributed across the Western half of the United States, leaving the two remaining parks in the Eastern half (Acadia in the Northeast, Great Smoky Mountains in the Southeast). These two parks (and Great Smoky Mountains in particular) likely attract visitors living on the East coast who don’t want to make a longer trip West. On the other hand, people living out West are spoiled for choice.
This land is your land
To avoid crowds, common sense dictates that I stay clear of the Big 10. However, the crowd in a park depends not only on the number of visitors, but also how much area a park has to hold its visitors. The National Parks vary greatly in size – for example, Wrangell-St. Elias National Park is the largest at over 8 million acres, while the Channel Islands contains only 250 acres.
I took [data](size on the area covered by each park to determine how crowded each park was in 2016. The following plot displays the number of visitors and the area of each park.
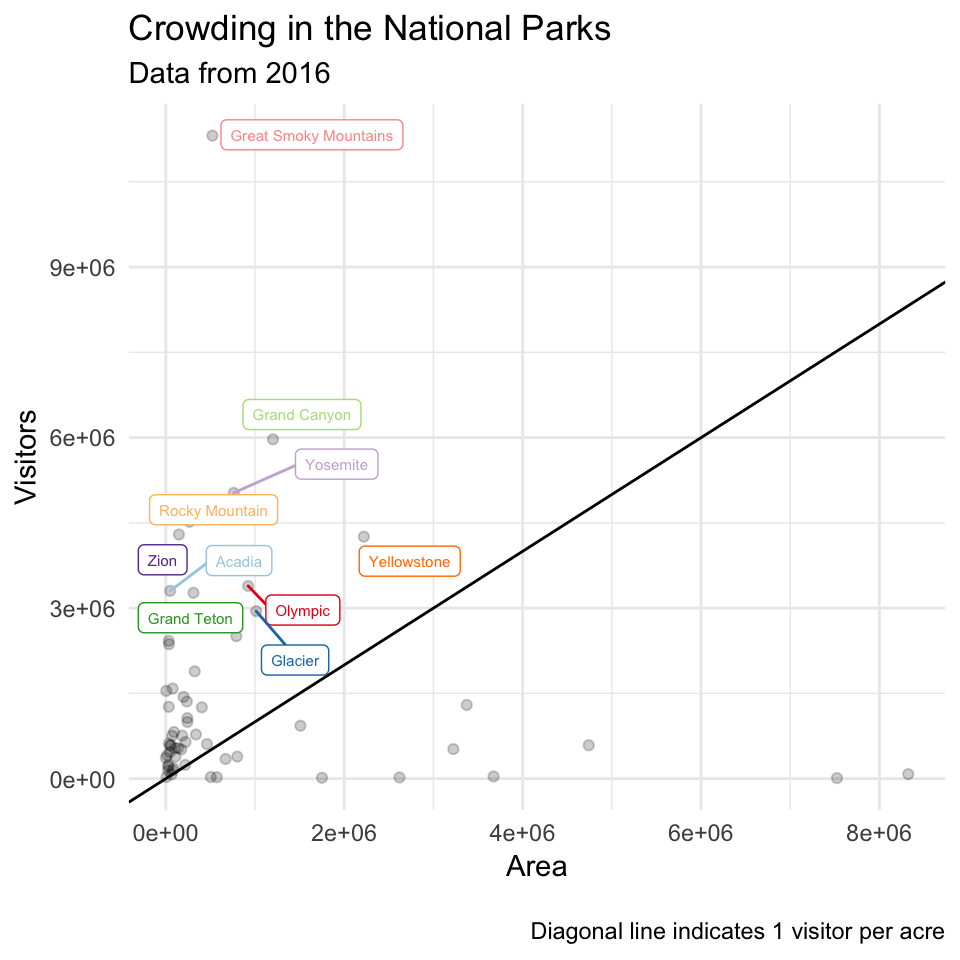
Parks below the diagonal line have less than a visitor per acre. These include some really large but rarely visited parks like Gates of the Arctic, which spans 7.5 million acres but only got 10,047 visitors in 2016 – the fewest of all national parks. Parks above the diagonal line have more than a visitor per acre. These include all of the Big 10.
I computed a crowd-factor for each park in 2016; the number of visitors divided by the number of acres in a park. This is an imperfect indicator of crowding, because not all of the area encompassed by a park is equally capable or likely to hold visitors (a better indicator of “habitable space” might be the number of campsites and miles of hiking trails, but I don’t have that data yet). The following plot displays the crowd-factor for each park.
I’ve truncated the graph above (a maximum crowd-factor of 80 is visible) so it’s more easily interpretable. The two parks with the highest crowd-factors are Channel Islands (crowd-factor = 1461.79) and Hot Springs (crowd-factor = 278.30) National Parks. The vertical line represents the average crowd-factor across all parks in 2016, which was 1.6 visitors per acre.
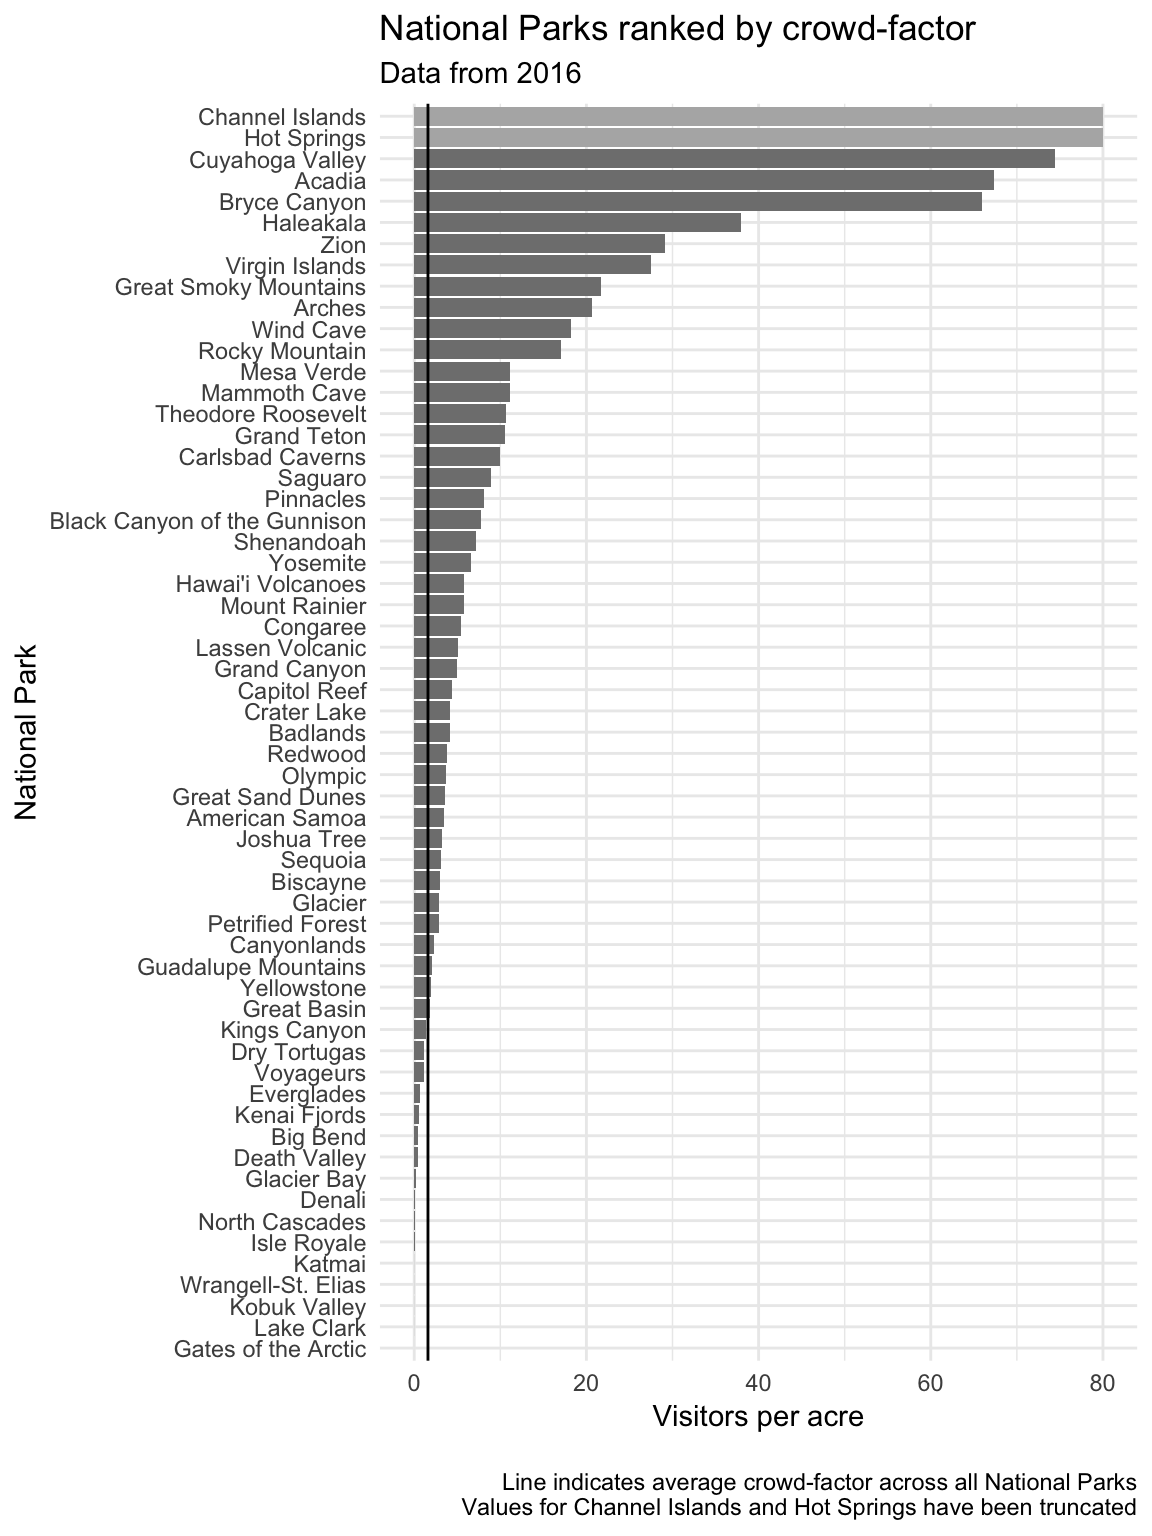
From the graph, we see that the majority of National Parks have crowd-factors above the national average. Popular parks will likely have higher than average crowd-factors, but this will be somewhat mitigated by having a larger area. For example, while Great Smoky Mountain had the highest number of visitors by far in 2016, it’s pretty large and could maintain a crowd-factor of 21.65 (while above the national average, it’s tolerable).
Small parks will also have higher than average crowd-factors, even if they tend to get fewer visitors on average. An exception may be Cuyahoga Valley, which had a lot of visitors in 2016 (2,423,390) for a park of its size (32,572 acres). I’ve been there; it’s accessible, pretty, and crowded.
If you’re looking for a non-crowded National Park visit, try one of the parks in Alaska – they generally score really low on crowd-factor.
Conclusion
To visit the National Parks and avoid the crowds, you’ll need to take into account the season. Unfortunately, I don’t have visitation data by month, but I’ll update this post to incorporate that information when I do. Still, simply taking into account annual visitation statistics and the size of each park gives you an idea of what to expect.
I’m torn when I see more people in the parks. On one hand, it’s good that more people are enjoying America’s natural wonders. On the other, I fear that the sheer numbers will overwhelm the fragile ecosystems and infrastructure that the National Park Service puts in place. I believe the National Parks are worth supporting.