How wrong were the polls?
Going into the 2016 Presidential Election, most pollsters were confident of a Clinton win. The aftermath of Trump’s win resulted in many questions being asked of pollsters and speculation as to how so many got it wrong. I won’t get into the reasons why; here are some articles with coverage on that. Instead, I want to focus on quantifying and visualizing the amount of error in the polls – where were they wrong, and how were they wrong? I used polling data collected by FiveThirtyEight and scraped the final results from David Wasserman.
Note: FiveThirtyEight’s dataset of poll results includes both raw and adjusted results. Adjusted results correct for historical biases in different pollsters, and can be useful for eliminating some noise from our visualizations (assuming we trust FiveThirtyEight’s adjustments). However, because I’m primarily interested in visualizing how the polls actually did, my analyses make use of the raw data, unless stated otherwise.
The popular-vote margin
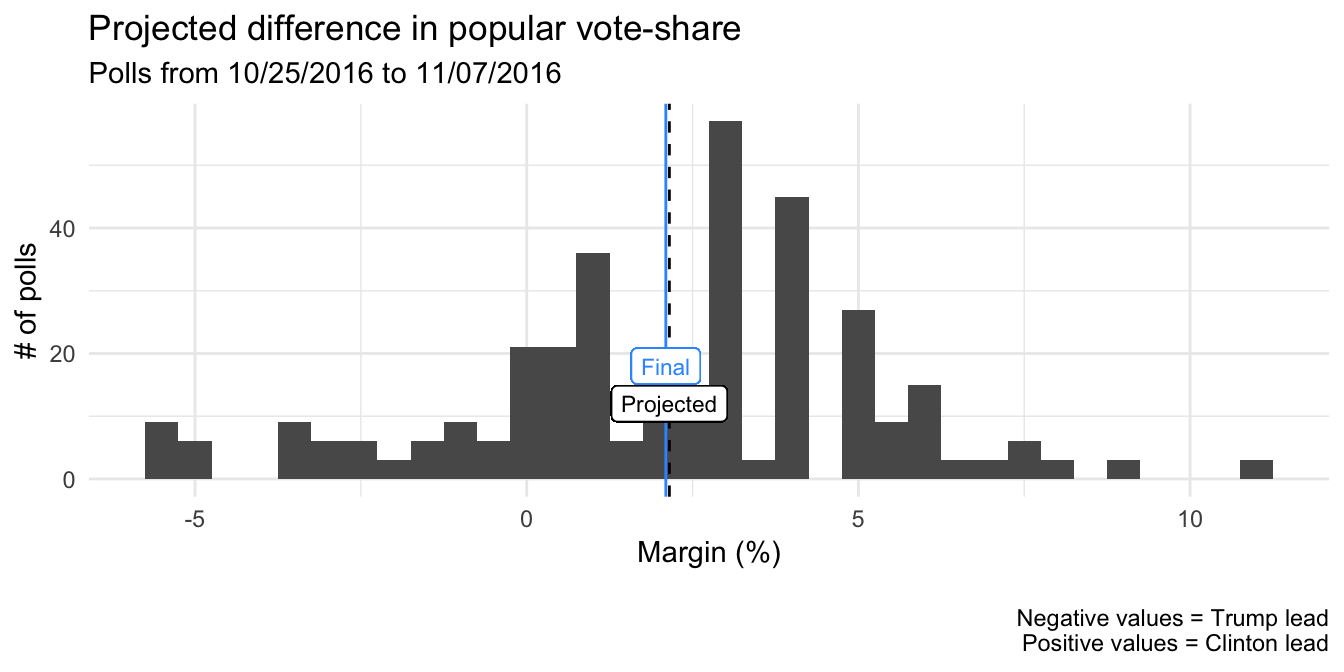
How well did the polls predict the margin between Trump and Clinton in the popular vote? The following plot shows the distribution of projected margins from national-level polls conducted on likely voters in the two weeks prior to Election Day (n = 348). In the final popular-vote tally, Clinton beat Trump by a margin of 2.1% (more than 2.86 million votes). The projected margin (estimated from the average of the polls in the final two weeks) was 2.2%. The polls appeared to do pretty well here – the projected margin was not significantly different from the final (actual) margin.

Error in popular-vote support for each candidate
The national-level polls in that final period did pretty well in estimating the final popular vote margin, but what about the absolute level of support for each candidate? A 2% margin can mean Clinton is polling at 48% vs. Trump’s 46%, or 40% vs. 38%. The estimated margin can be pretty accurate even if the projected vote-shares for the candidates are off, provided they are both off in the same direction (i.e. the polls were not systematically biased for one candidate but not another).
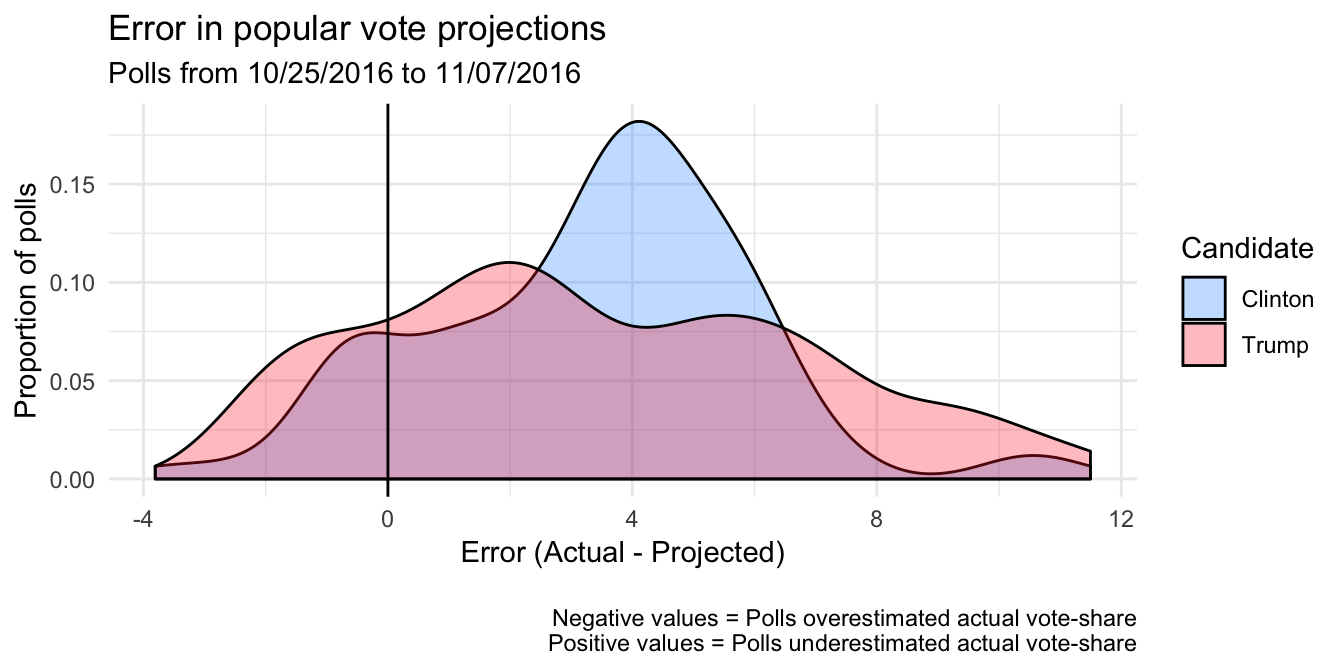
The polls underestimated the vote-shares of both Clinton and Trump. If the polls were not biased, the error for both candidates in all polls would be centered around zero. In the following plot, we see that the errors were consistently above zero. Error was the difference between the final and predicted vote-share (from a given poll) for a particular candidate – positive (negative) error means a poll underestimated (overestimated) the final outcome.

Visually, it appears that slightly more polls overestimated Trump than Clinton (Trump’s distribution shows slightly more polls within the range of negative errors). Most polls underestimated both candidates. However, it seems that the largest number of polls underestimating Clinton did so by around 4 percentage points (notice the peak of Clinton’s density plot), while more polls that underestimated Trump did so by larger amounts (notice the fatter tail of Trump’s plot, indicating positive skew in the errors).
From this sample of polls in the two weeks immediately preceeding Election day, national-level polls were generally accurate about the margin between the candidates (projecting ~2% lead for Clinton), but underestimated the vote-shares of both candidates. Polls underestimated Clinton mostly by about 4 percentage points, while there was more variability in how much they underestimated Trump. Quite a few polls underestimated him by quite a bit – by more than 5 percentage points!
Errors in state-level polls
While national-level polling doesn’t seem to have done too badly in predicting the popular-vote margin, errors in state-level polls can be more costly because of how the Electoral College works. Ultimately, whether a candidate wins the popular vote within a state determines whether they receive the electoral votes they need (with the exception of a couple of states). How well did state-level polls do in estimating the margins in the state-level popular vote? Were polls in some states especially biased?
With any poll, there will be some over or underestimation of the margin. If the actual margin in a given state is a Trump win by ~ 2%, a poll biased towards Trump (projecting a win of > 2%) may have a projected margin that’s too high, but it would still project the right outcome (Trump wins). A poll biased towards Clinton could project the right outcome if the bias is small enough (if the bias is 1% towards Clinton, then Trump shoulds win by ~ 1%), or it could get the outcome wrong if the bias is large enough (if the bias is 3% towards Clinton, then Clinton should win by ~ 1%).
If the polls were all equally accurate, we would expect that the distribution of bias to be symmetrical around 0 (though no single poll would have exactly 0 bias, the average bias of all the polls across all the states should come close). We woud also expect that across states won by each candidate, the projected margin will sometimes be overestimated, and sometimes be underestimated.
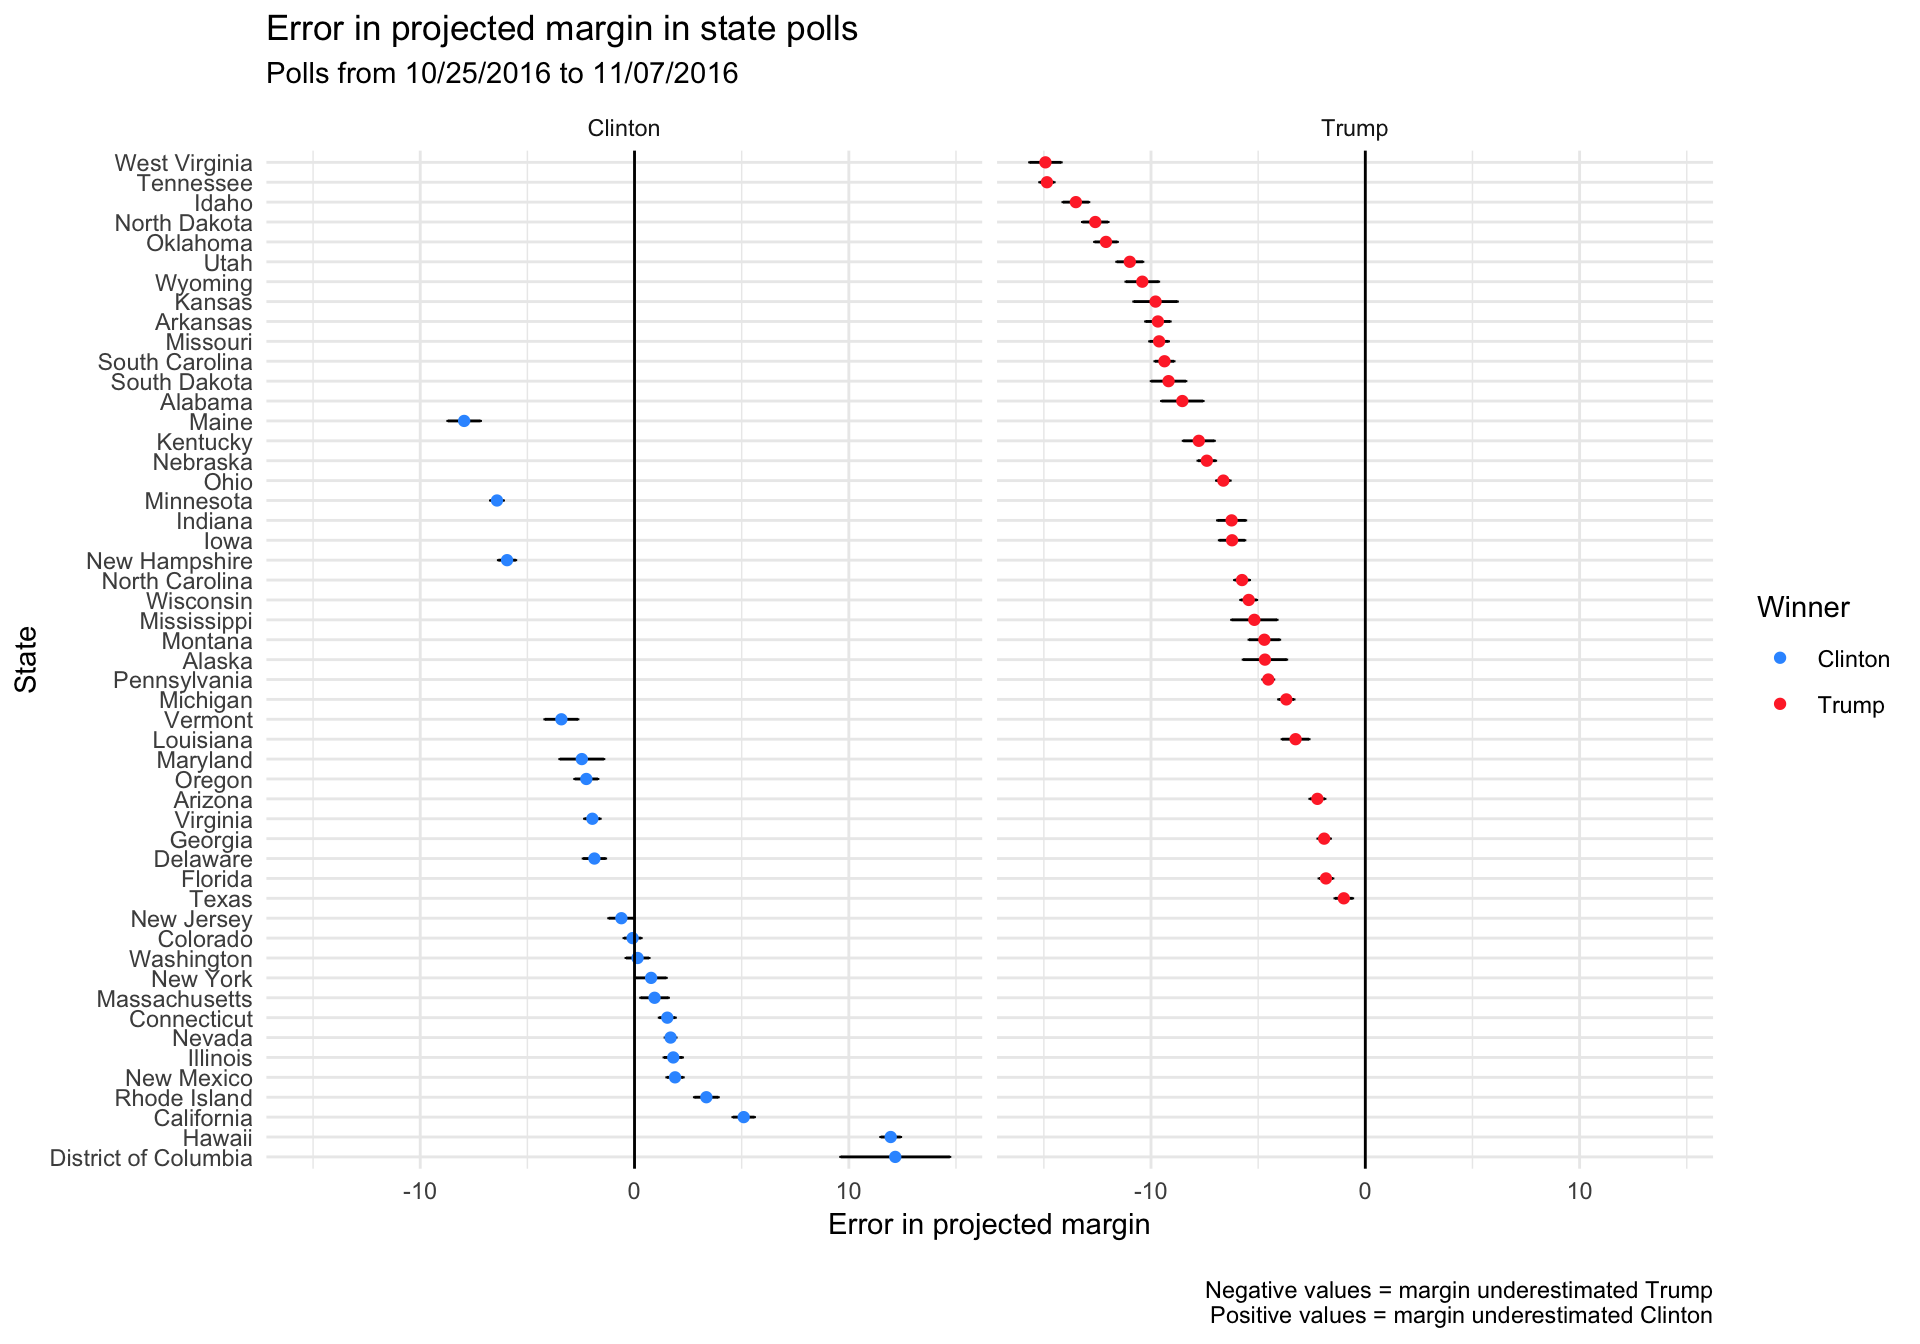
The following plot displays the errors between the actual state-level popular vote margin and the margin projected from polls in the last two weeks of the campaign. The separate plots are for states won by either candidate, and they’re arranged from states where Trump was most underestimated to states where Clinton was most underestimated.

A few things jump out from this plot:
- The majority of polls underestimated Trump (ie. had positive errors), except for 11 states that either got the margin right (Colorado and Washington, both correctly projecting a Clinton win) or underestimated Clinton (i.e. had positive errors) – New York, Massachusetts, Connecticut, Nevada, Illinois, New Mexico, Rhode Island, California, Hawaii, and the District of Columbia.
- Looking only at states that Clinton won, polling error was distributed quite symmetrically – she was overestimated in some states, underestimated in others. This is what you’d expect for both candidates and the set of states they won if there was nothing systematically wrong with the polls.
- Trump was underestimated in every single state that he won, suggesting there was a systematic bias in polling within those states. If there was no systematic bias, we would expect the errors to be distributed more evenly around 0.
In states where polls showed a Trump victory, the actual margin would be larger than projected. In states where polls showed a narrow Clinton victory, the amount of bias played a big role – if the polling was biased against Trump sufficiently, the actual outcome would be flipped. This mattered most of all in several close swing states where Clinton was expected to win but ended up losing.
Conclusion
As stated above, there’s been a ton of analysis about how the polls missed Trump’s win. This post has avoided those issues, except to show that there are specific ways that the polls did and did not get things right. I’m planning to write more on the data presented here – I would love to talk if you have any ideas for interesting analyses!
