Predictably comforting: The writings of Soo Ewe Jin
My father passed away on November 17, 2016. His life has been memorialized in countless tributes published in the Malaysian press and on social media. An executive editor at the most widely-read English daily in Malaysia, he had a popular weekly column: Sunday Starters.
As a way of navigating the mourning process, I set out to collect all his writings published in The Star. I’m sure the editors would have given me all his writings if I had asked, but instead I wrote some code to scrape all 366 articles he authored from the website. To try this yourself, run scrape_articles.R, which retrieves all his articles and saves them into a data frame.
Plenty of people found my dad’s writing to be encouraging and comforting – I’ve been told that it fell within the chicken-soup-for-the-soul genre of writing. While that is a decent high-level characterization of his body of work, I sought a more satisfactory data-driven description.
In his own words
Words are a writer’s tools, used to convey information and elicit responses in readers. The first part of this analysis looks at the words my dad used in his writing. Perhaps the words he used can shed light on the kinds of concepts he was most interested in communicating to readers.
Who was his favorite?
My dad was fond of writing about his family, though we hated when we became unwitting subjects of the week’s column. He usually anonymized our appearances as requested, but sometimes mentioned us anyway. The following graph displays the number of appearances by each members of our nuclear family (both in name and title).

My wife (“Evelyn”) got one mention in my dad’s last few columns. He mentions “son” 76 times, but this doesn’t discriminate between mentions of Tim (my brother) and I. I am mentioned by name twice, compared to Tim who is mentioned five times. All these mentions pale in comparison to my mother – she is mentioned by name (“Angie”") once, but referred to as his wife 136 times.
Frequently-used words
A crude way of determining what he wrote about is by looking at his most frequently-used words. The following graph plots the frequencies of the 25 most common words in his writing (excluding stopwords like “a” and “the”).

Some of these high-frequency words give us clues about his subject-matter: “people” (857 appearances), “time” (696 appearances), and “life” (561 appearances) fit pretty well on a conceptual level with the focus of his column – reflections about appreciating people and everyday things. Since the text I analyzed consisted of 366 articles, most of these words appeared more than once per article.
Visualizing these in a wordcloud gives us more room, so we can look at the 100 most frequently used words (each of which appears > 130 times in his writings). The size and color of each word corresponds to how frequently it appears in his writing.
 In the wordcloud, you’ll see other semi-frequent words like “work” (423 appearances), “world” (392 appearances), and “friends” (292 appearances) that give you more hints of what he often wrote about. However, word-frequency alone doesn’t paint a very clear picture. There are some high-frequency words like “will” (1012 appearances), “can” (920 appearances), and “one” (831 appearances) that don’t suggest particular subject-matter and are highly dependent on context.
A bigger problem is that we’re assuming particular nouns work as standalone markers and evidence of particular topics. However, the absence of a word (e.g., “friends”) doesn’t necessarily mean that a particular topic isn’t being written about. The following analyses look beyond individual words to the relationships between words.
Word neighbors
A word’s immediate context may give us an idea of what it means. If a word like “will” often appears near “friends”, then the writer is probably using it to write about the things that friends tend to do, rather than using it in reference to a legal document. Restricting the analysis to the 25 most frequently-used words, we can calculate the euclidian distance between each pair of words. These distances are plotted in the following heatmap, with darker colors representing pairs that appear closer together on average. The distance between each word with itself, which is 0, is represented on the diagonal.

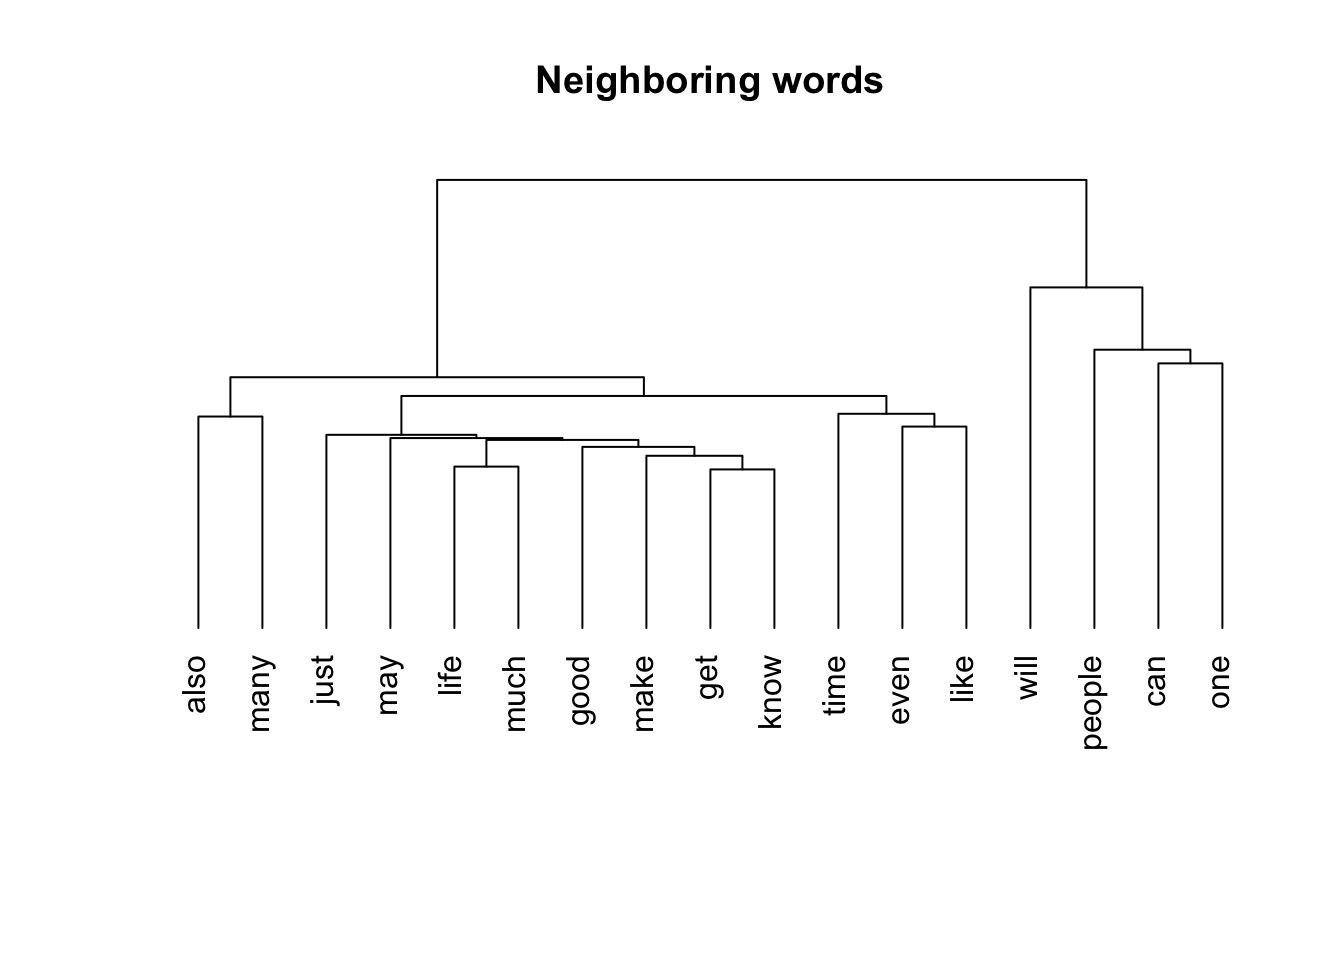
Unfortunately, it’s hard to decipher any meaningful pattern in the distance between pairs of words from the heatmap. From the computed distances, we can generate a dendrogram (a type of tree graph) to identify pairs of words that are “neighbors” of each other.
This dendrogram organizes the 25 most frequently-used words by their distance to each other, revealing “neighborhoods” of words. This highlights words that are frequently used in tandem, suggesting either that they are parts of commonly-used phrases (e.g., “one time”), or that they are concepts the writer treated as related (e.g., “work” and “life”).
 Moving down the tree, each branching creates two neighborhoods, showing us which word neighborhoods are close to each other. At the lowest level, we can see which individual words are neighbors with each other.
From the top-down, the first level of branching produces one large and diverse neighborhood on the left, and one smaller but more focused neighborhood on the right. This latter neighborhood seems to represent a cluster of words used in tandem with “people”, suggesting my dad wrote a lot about people using these words.
I’ve not attempted an exhaustive analysis of the words in my dad’s writings. People are free to infer how these words all relate to each other and what they imply about the subject-matter of his writings. My goal in this section was simply to compute these basic statistics and visualize them to memorialize the words he used. The following analyses move beyond surface-level words to focus on deeper information – the topics – contained in his writings.
Underlying topics
As mentioned above, the absence of a particular word doesn’t imply that a particular topic isn’t being written about. In this section, I attempt to build a topic model of my dad’s writings. A topic model assumes:
In a collection of writings by a single writer, there will be a number of topics being written about. The data here consists of 366 articles by my dad. There will be more than one topic because the articles are not all about the same thing, but there will not be 366 topics because multiple articles will be about the same topic. Every writer probably writes reliably about a small number of topics (we’ll say a columnist like my dad probably wrote about 2–5 topics throughout his writings).
Each topic is written about using reliable collections of words. When writing about a particular topic, a writer tends to use the same words. These words need not contain an explicit label for the topic (e.g., a topic about “sports” need not contain any names of sports; they could just contain verbs like “run”, “kick”, and “jump”). A topic is thus a cluster of co-occuring words that are linked by some underlying generative process – a writer “generates” these words when communicating a particular topic.
Each article is about a combination of the topics in different proportions; we figure out the proportions from the words that are present. Some articles are about a particular topic more than any other – if so, we expect to see many words associated that topic, but few words associated with other topics. Some articles are about multiple topics, in which case we expect to see words associated with multiple topics.
Identifying the topics
It’s tricky to identify the number of topics (k) present in a corpus. There are some mathematical approaches to determining the optimal k, but they do not always produce topics (i.e. clusters of words) that are semantically meaningful. A simpler method is specifying an a priori number of topics, running the algorithm, and looking at the words (terms) associated with each topic to see if they are semantically meaningful. As mentioned above, k of 2 to 5 seem like reasonable values for a columnist like my dad.
Using the topicmodels package, I ran the Latent Dirichlet allocation (LDA) algorithm with k = 2, 3, 4, and 5, and determined that having three topics produced the best (most meaningful) topic distribution. The table below shows the three topics, which I have named, along with the top five terms associated with each.
| Encouragement | Reflections | Society |
|---|---|---|
| can | life | work |
| people | time | public |
| will | way | Malaysia |
| still | day | country |
| world | one | first |
The Encouragement topic probably encompasses writings of my dad where he gave exhortations to his readers to positively influence the world. Reflections probably include musings about aspects of daily life and the passage of time. Articles about Society are about the workplace and aspects of Malaysian society.
Classifying articles
The following graph displays the classification of all the articles based on their dominant topics.

I simply categorized each article based on which topic was most present. However, as noted above, multiple topics can be present in different proportions in a given article. Therefore, classifying articles in this way loses significant information about the mixture of topics.
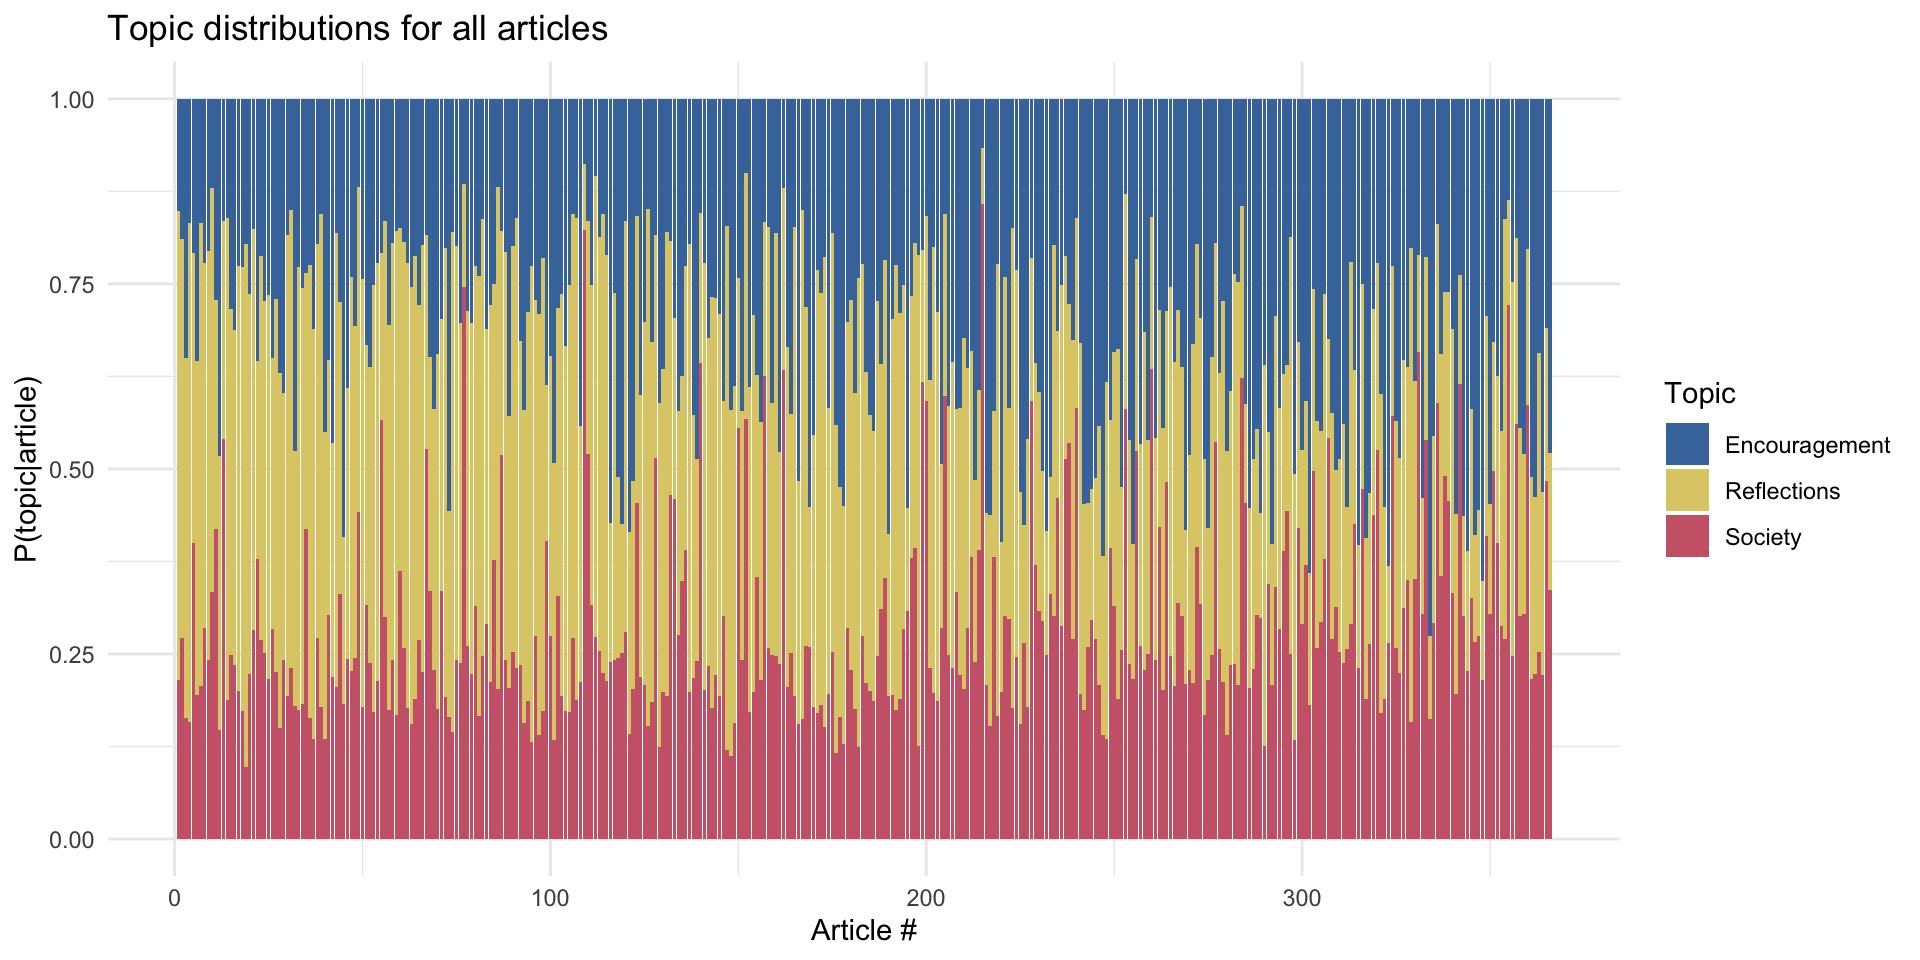
For each article, LDA actually gives us the topic distribution, P(topic|article), such that the mixture of all topics sums to 1 within each article. An article classified as “Encouragement” above may have gotten that classification despite all topics being somewhat equally present, but with P(topic = Encouragement|article) being slightly higher than the second-most present topic. For a fuller picture, the following graph plots the topic distributions for all my dad’s articles.

As can be seen, my dad wrote pretty evenly about all three topics in all his articles. However, it might be interesting to look at articles where one topic was significantly more present than the others, to see how well the topic model did. For each topic, I looked for one article where the topic distribution heavily favored the main topic relative to the other two. The following table displays these articles and P(topic|article) for each topic (the probability of the main topic is bolded).
| Article | Encouragement | Reflections | Society |
|---|---|---|---|
| Repair – the fourth ‘R’ missing in our lives | .58 | .21 | .21 |
| My silver lining | .15 | .70 | .15 |
| A time for reflection | .09 | .09 | .82 |
From reading the articles, it might be difficult to distinguish between Encouragement and Reflections. This is because all articles contain some mixture of the two, and because there is probably some conceptual overlap between these topics.
An interesting result is that articles about Society tended to be those that were not from his weekly column – they tended to be profiles, interviews, and obituaries of prominent figures in Malaysia’s civil society and business world. Most of these articles were found in the business section of the newspaper – where he also contributed some writings.(It is also worth noting that the article above about Society is titled A time for reflection, but is actually an article reflecting on the life of a prominent member of Malaysia’s legal fraternity that doesn’t contain the type of reflection typical of his Reflections).
We expect articles in the business section to be about Society much more than we expect them to be Encouragement or Reflections. I checked how many of his articles from the business section (52 of them) the LDA process correctly classified as being about the Society topic.

Only 22 of 52 articles he wrote in the business section were classified as being about Society. It seems that even when writing in the business section, he could not help but include Encouragement and Reflections. That’s just the kind of person he was.
Writing over time
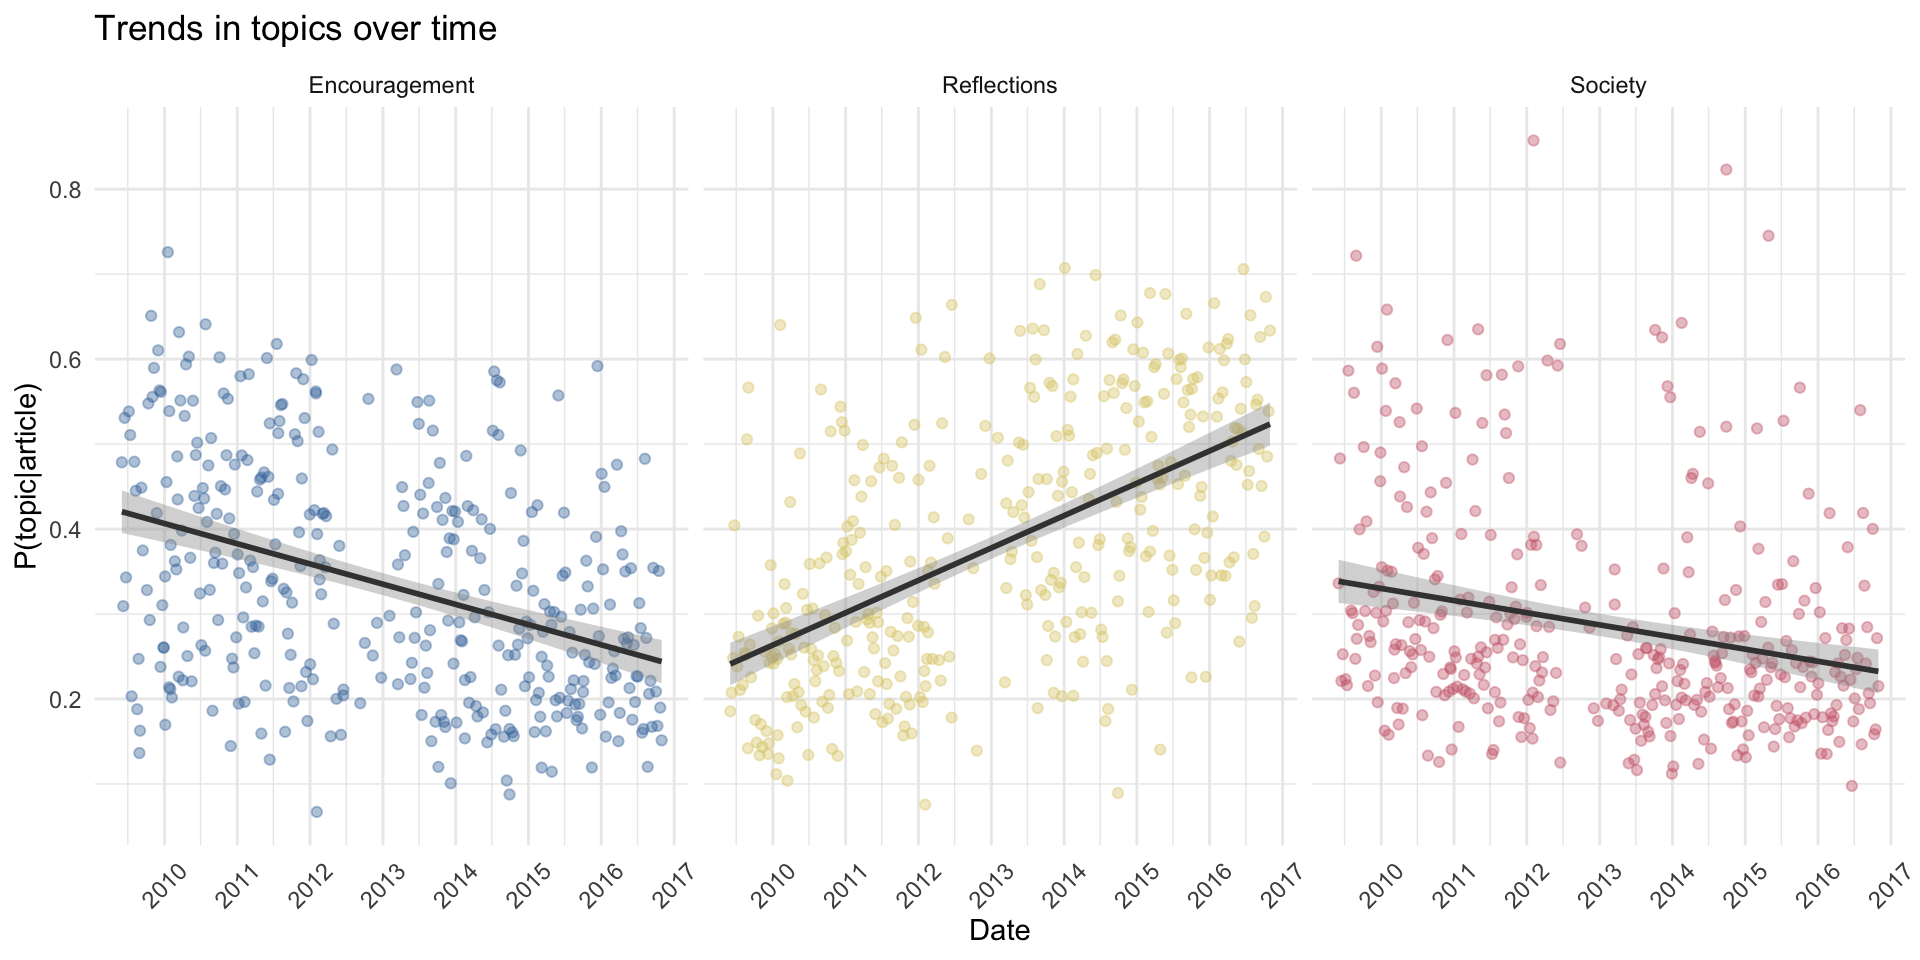
The prior analysis shows my dad’s writings were pretty consistently about three dominant topics. Did his focus on each of these topics change over time? The following graphs plot P(topic|article) for each topic over time. A linear trend has been fitted to each graph so we can see if there are trends over time in each topic.

Society generally had a smaller presence in most of his writings – there seems to be the occasional article that is strongly about the topic, while it is present only at a low level for the majority of his writings. My dad occasionally wrote articles for the business and news sections of the paper, which probably accounted for the articles where P(topic = Society|article) are high. He worked in the business section in his earlier years, but stopped writing for them later on – which appears to be reflected in the overall decrease in this topic’s presence in his writings.
Over time, his writings increasingly focused on Reflections and less on Encouragement (the correlation between these topics is negative, r = -.59). This doesn’t mean my dad was getting less encouraging, merely that over time his writings consisted less of words exclusive to that topic (and even in his last few years, P(topic = Encouragement|article) was still pretty high – around .3 on average). My best guess is that my dad became more reflective (see the increase in Reflections over time), and that decreased the space he could dedicate to other topics.
Conclusion
As much as an analysis of word frequencies and topic models can shed light on the content of my dad’s writings, they cannot capture everything. This failure goes beyond the deliberate simplification of problems I have permitted to keep things practical, and beyond the subjective nature of some of these analyses (e.g., I don’t have any more justification for choosing k = 3 other than that those three topics make sense).
The analyses fail because my dad was much more than just his writings. I do not present any analyses that allow us to make inferences about the character of this man.
What I am doing is inherently reductionistic – I want to summarize his writings to make sense of them. My dad loved writing, so this is an attempt to preserve that which he loved. My dad wrote about matters of the heart, and probably would not have bought fully into the data-driven approach I have used.
This post is dedicated to Soo Ewe Jin (1959–2016).